S
ETUP
.E
XE
C-18
M
o
ti
o
n
M
en
u
G
ra
p
h
ic
A
n
a
ly
si
s
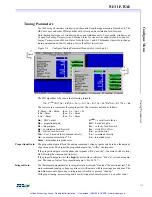
Graphic Analysis
The
Graphics Analysis
window provides a visual guide to tuning closed-loop systems. Motion
is controlled by the parameters set on the
Motion/Two-Point
window. Trapezoidal, parabolic
or S-curve motion may be commanded. Endpoint positions, velocity, acceleration and jerk may
also be selected.
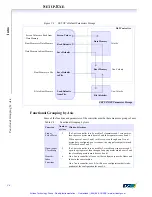
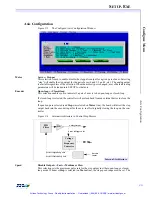
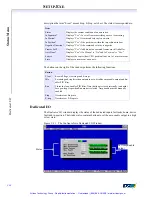
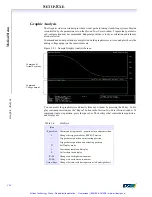
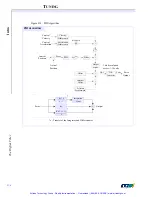
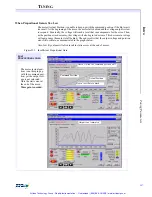
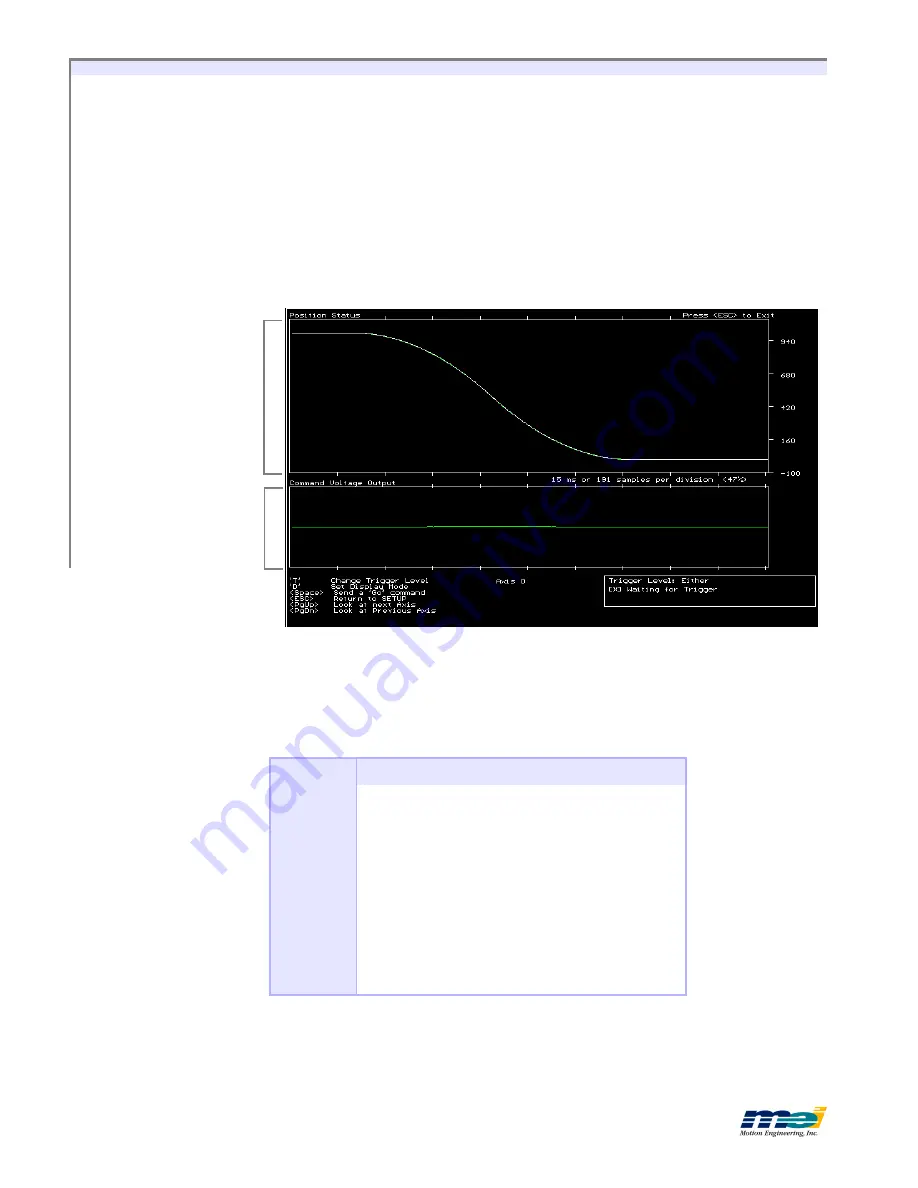
Command and actual position are overplotted on the graphic screen. A second plot shows the
analog voltage output on the same time scale.
Figure C-13
Sample Graphic Analysis Screen
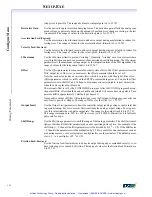
You can access the graphics screen directly from any window by pressing the F4 key. To dis-
play continuous motion, use the “Repeat” button in the
Motion/Two-Point Motion
window. To
command single-step motion, press the space bar. The hot keys that control data acquisition
and display are:
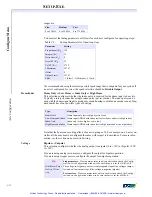
Table C-6
Hot Keys
Key
<Space Bar>
Command a single move - acquire data in either direction
T
Change the trigger mode for REPEAT motion
+
Trigger data acquisition on increasing position
-
Trigger data acquisition on decreasing position
D
Set Display mode
C
Continuous sample and display
S
Collect data then display
P
G
U
P
Change to next higher axis number
P
G
D
N
Change to next lower axis number
Arrow Keys
Change the time scale during motion (left and right keys)
Command &
Actual Positions
Command
Voltage output
Artisan Technology Group - Quality Instrumentation ... Guaranteed | (888) 88-SOURCE | www.artisantg.com

