Export Button:
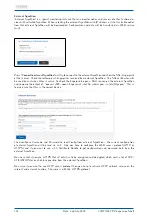
With the
"Export"
button a PNG file of the current graph will be generated. This can be used for printing and
saving.
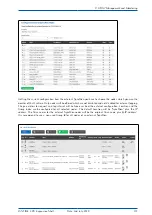
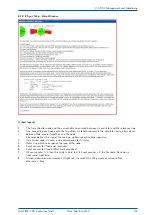
Generate Report Button:
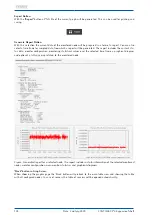
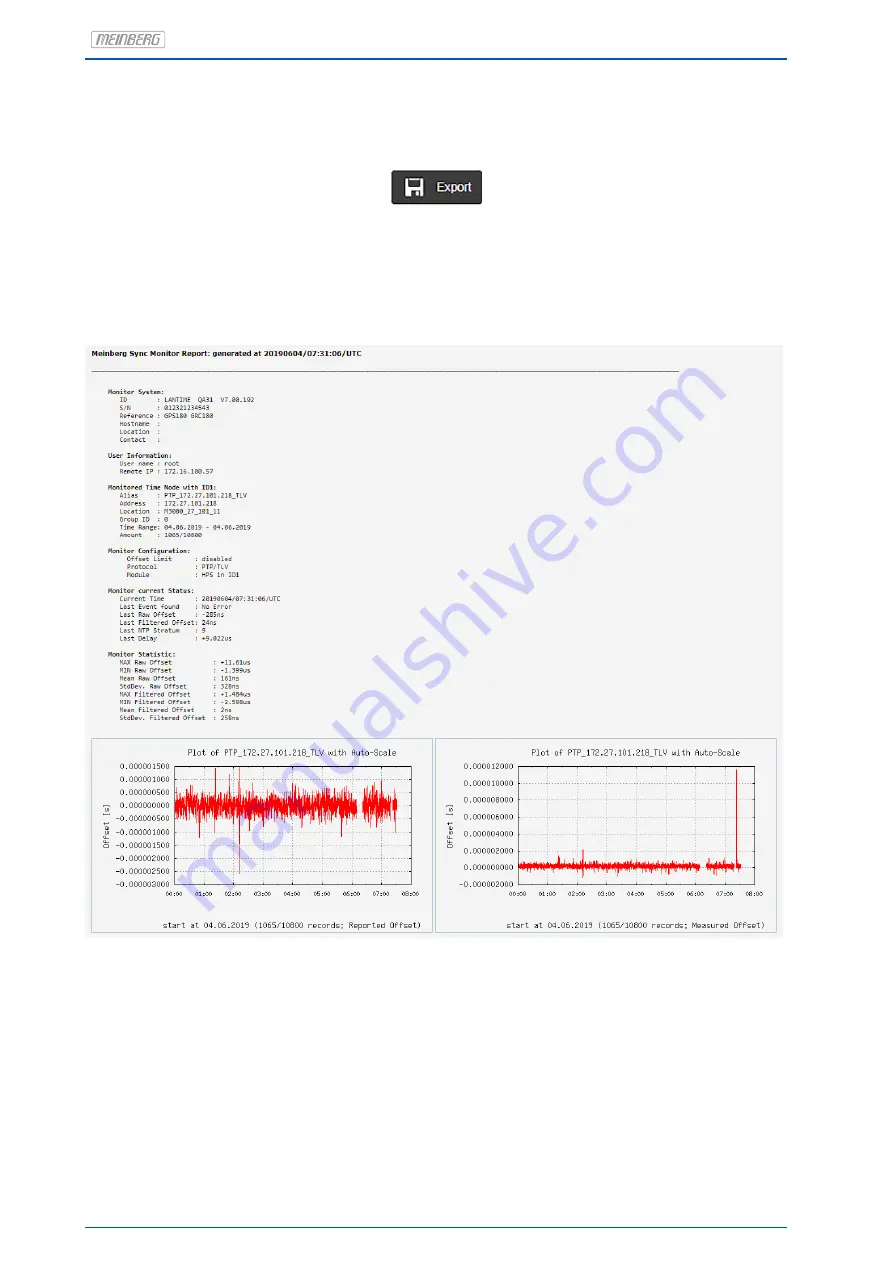
With this selection the current data of the monitored node will be prepared in a form of a report. You can also
select a time frame for sampled data from which a report will be generated. The report includes the current sta-
tus data, monitor configuration, monitoring statistical values over the selected time frame, a graphical diagram
and optional a full sync map related to the monitored node.
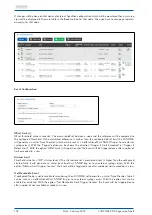
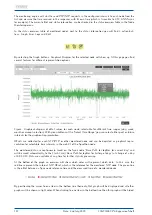
Figure: Generated report for a selected node. The report includes a status information of the selected monitored
nodes, monitor configuration, main monitor statistics and graphical diagrams.
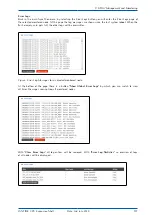
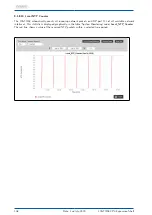
"Back" button in Graph view:
When choosing the graphic page the ’Back’ button will go back to the main table view and showing the table
with all configured nodes. In case of sensors the table of sensors will be opened automatically.
126
Date: 2nd July 2020
LANTIME CPU Expansion Shelf
Summary of Contents for LCES
Page 2: ......

