- 29 -
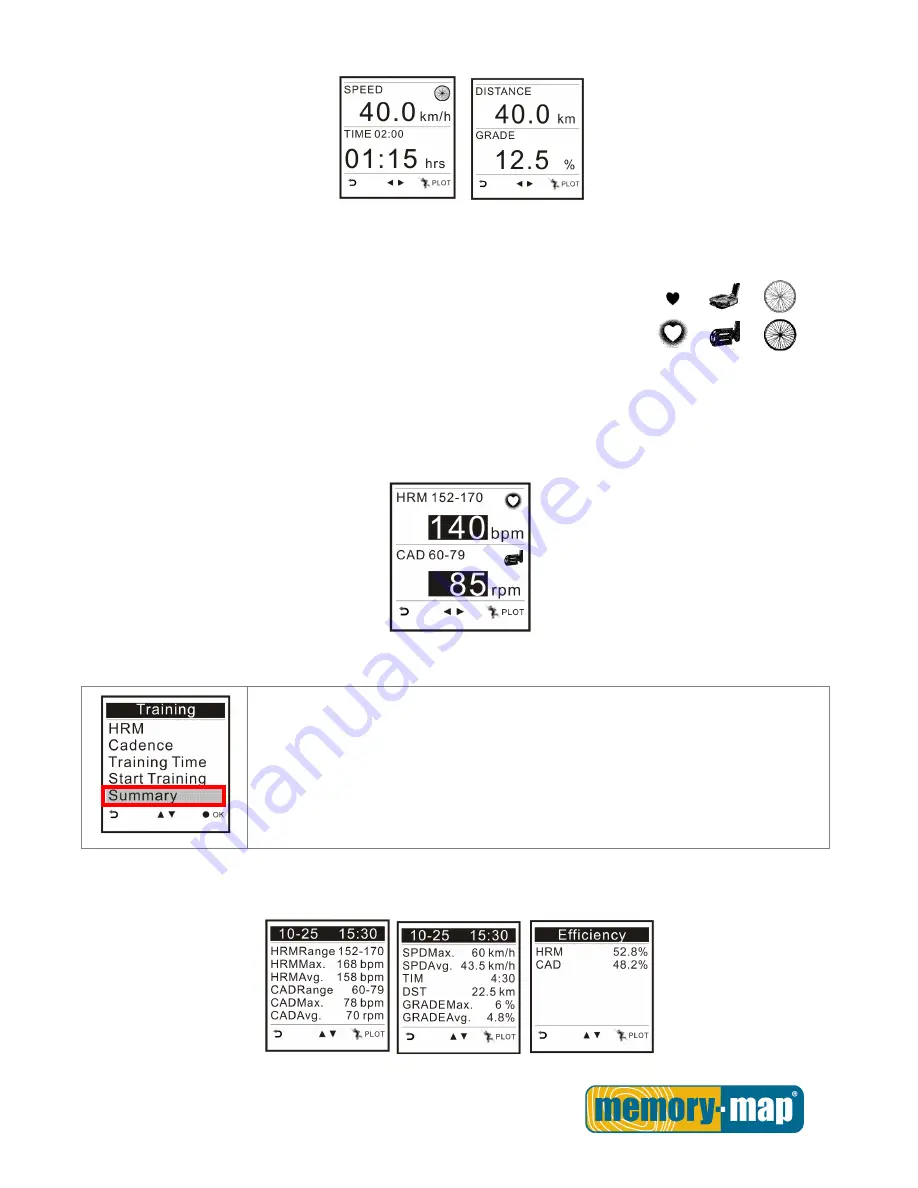
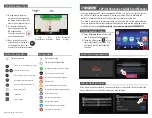
The icon of HRM/Cadence or Speed varies according to the status of the corresponding sensor.
(i). The icon flashes and is displayed steadily to indicate the corresponding
sensor is well connected;
(ii). The icon freezes when the corresponding sensor signal is lost for a short
period of time.
(iii) . The icon disappears if the corresponding sensor signal is lost.
If current HRM/Cadence or Speed exceeds or falls behind the user’s pre-setting range, the corresponding
value will be highlighted for notification.
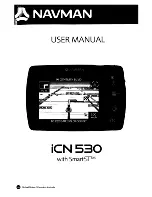
Summary
You can check your physical fitness after workout on the Summary page. The
training summary can be displayed in numbers or in graphic (plot mode).
Information shown includes HRM range/maximum/average, cadence
range/maximum/average, speed maximum/average, training time, distance,
maximum grade and average grade.
The HRM and Cadence efficiency can be displayed in percentage as a brief summary of your fitness for the
workout.


