34
Operating Instructions - CPC6050
Modular Pressure Controller
CPC6050
6.4.1.4 Bar Graph
An optional bar graph can be displayed below the current pressure value. The bar graph indicates the
relative position of the current value with the maximum range of the primary transducer in that channel.
This bar graph will appear in the Home App when selected from the Display Settings App (section 6.4.4).
6.4.1.5 Auxiliary Displays
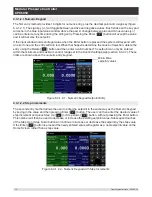
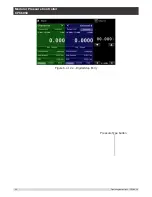
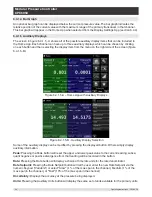
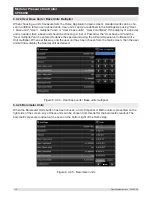
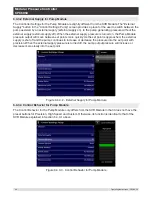
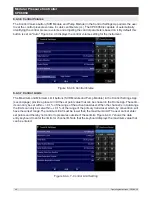
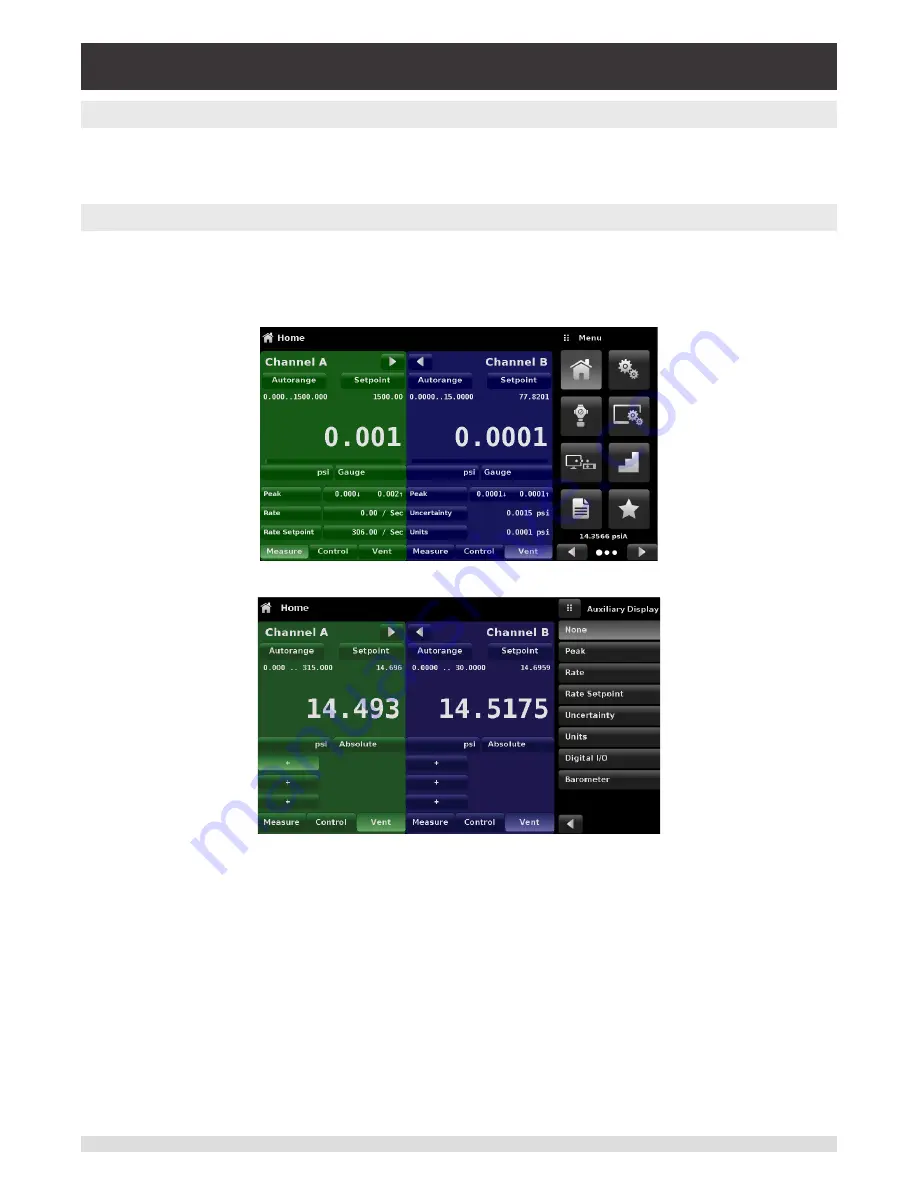
The screen in figure 6.4.1.5 - A shows all of the possible auxiliary display items that can be included in
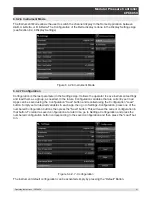
the Home App. Each channel can have up to three auxiliary displays which can be chosen by clicking
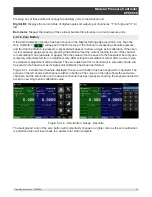
on each button and then selecting the display item from the menu on the right side of the screen (figure
6.4.1.5-B).
Figure 6.4.1.5-A – Home App with Auxiliary Displays
Figure 6.4.1.5-B - Auxiliary Display Selection
Some of the auxiliary display can be modified by pressing the displayed button. Others simply display
auxiliary information.
Peak: Pressing the Peak button will reset the upper and lower peak value to the current reading, subse-
quent negative or positive divergence from that reading will be recorded in the button.
Rate: Pressing the Rate button will display a choice of time rate units for the rate denominator.
Rate Setpoint: Pressing the Rate Setpoint button will let the user enter the new Rate Setpoint via the
numeric Keypad (“Variable”) or select “Slow” (.1% of the max span in the channel), Medium (1% of the
max span in the channel), or “Fast” (10% of the max span in the channel)
Uncertainty: Displays the accuracy at the pressure being displayed.
Units: Pressing the Auxiliary Units button will display the same set of units available for the primary units.

