32
WIKA operating instructions hydraulic high pressure controller, model CPC8000-H
PN 0018708001B 11/2020 EN
EN
6.4.1.7
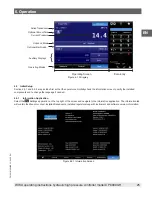
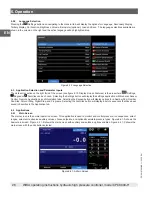
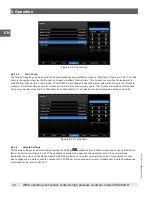
Bar Graph and Control Limits
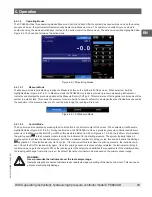
The Bar Graph is always active on the main screen and it displays the real time pressure on the Measure/Control port. It is
displayed in the form of a blue bar that spans left to right to provide a visual comparison between the actual pressure and the
control limits. When completely vented, the screen will display a blank white bar as seen below.
Control limits are the minimum and maximum limits that are entered in the Settings
application. These limits will default to the
maximum primary range of the instrument, but can be adjusted to any desired limit within the transducer range. This limits will also
limit the value that can be entered as a setpoint. If a value outside this limit is entered, the instrument will display the value in red.
Control Limits
Figure 6.4.1.7 Bar Graph/Limits
Bar Graph
6.4.1.8
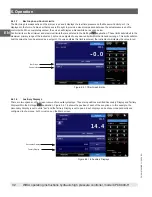
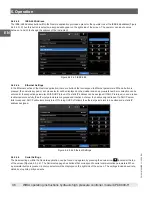
Auxiliary Displays
There are two spaces on the screen reserved for auxiliary displays. These two positions are titled Secondary Display and Tertiary
Display within the Settings
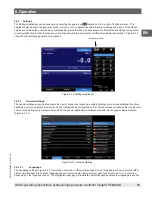
application. Figure 6.4.1.8 shows the position of each of these options. In this example, the
Secondary Display is set to units "bar" and the Tertiary Display is set to peak. Each display can be chosen independently and
configured to show none, both or just one on the Main screen.
Tertiary Display
Figure 6.4.1.8 Auxiliary Displays
Secondary Display
6. Operation


