Revision 21_Sep_2015
53
User Guide Version 2.60 I-button WHO 5th
SQA-V Linearity
Clinical claims:
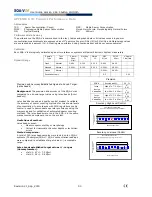
Linear Sperm Concentration throughout the SQA-V dynamic
range of 2M/ml to 400M/ml:
Squared regression coefficient of Dilution Curve R
2
≥
0.9.
Averaged coefficient of variation CV of measured vs.
expected sperm concentration
≤
20%.
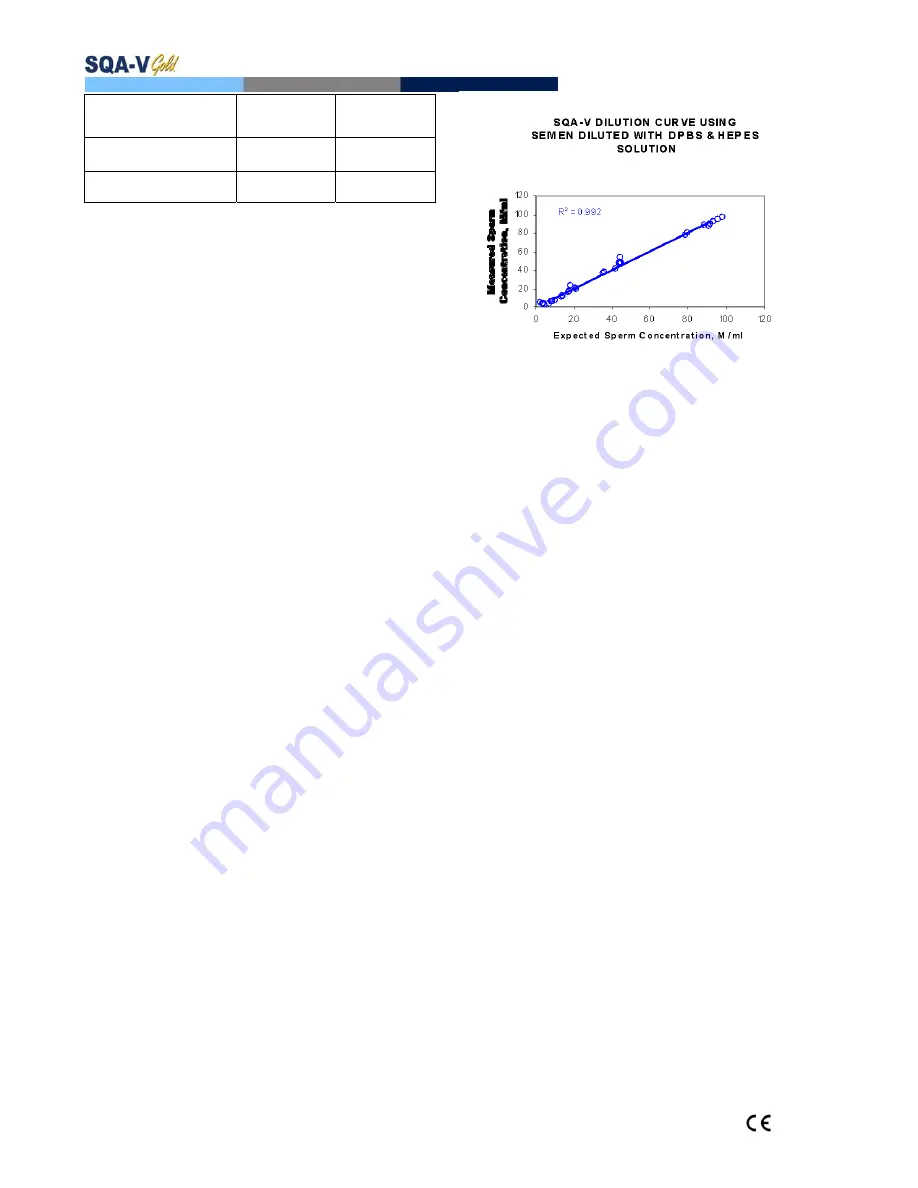
Goal: To demonstrate the ability of the SQA-V to accurately
report sperm concentration along the dynamic range of the
system using sequentially diluted human semen samples.
SQA-V Automated
System and Visualization
System
207
95%
Visualization System only
193
89%
Microscope only
161
74%
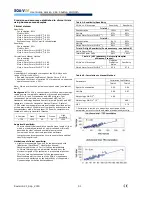
Methodology:
4 fresh human semen samples were pooled,
divided into two aliquots and centrifuged at 600g for 15 minutes.
The seminal plasma was decanted and the pellets were re-
suspended in washing media: DPBS & HepesHTF. Sequential
dilutions were run in 4 SQA-V systems.
Limitations of method:
Dilution errors contribute to the accuracy of the linearity
test results.
Sample handling errors such as the introduction of bubbles
into the testing capillary can cause inaccurate readings.
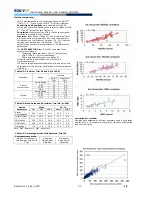
Results:
1.
Squared regression coefficient R
2
of Dilution Curve (trend line)
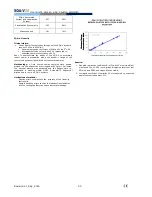
was found to be 0.992 (note: graph displaying results of four
SQA-V’s and DPBS and Hepes dilution media).
2.
Averaged coefficient of variation CV of measured vs. expected
sperm concentration was 10%.

