42| 52
blue’Log X series
9.
Visualization
9.1
Sensors
1.
Navigate to the "Cockpit" area via the top navigation bar.
2.
Navigate to the "Diagrams" area via the left-hand navigation menu and select
"Sensors".
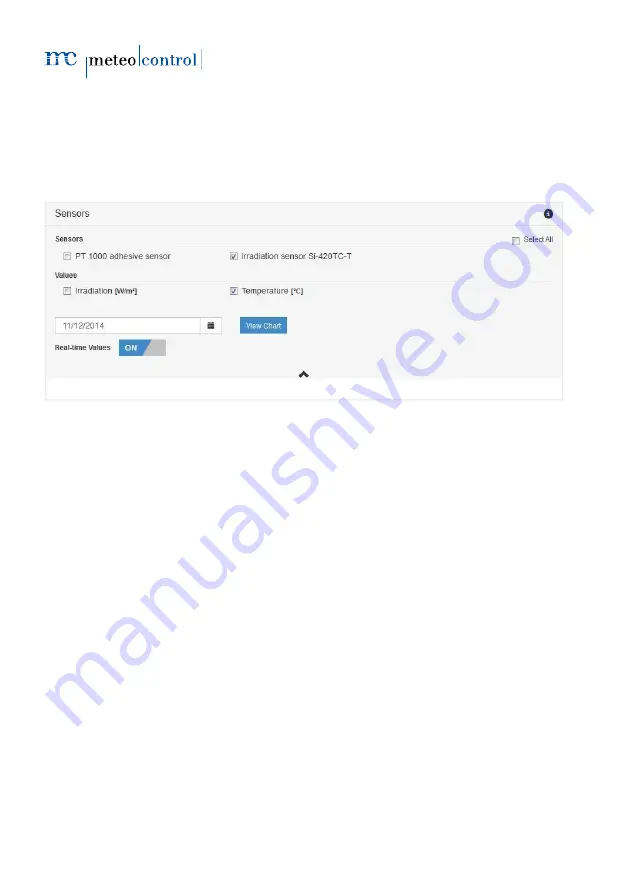
Fig. 26: Device websites: Selecting diagram options – sensors
3.
Select those sensor(s) you would like to visualize the measured values of.
4.
Select the available measured values. All measured values available for the current
selection are displayed. For individual sensors a number of measured values in
parallel are available while for displaying several sensors at once, only one
measured value can be selected.
5.
An additional option is given to include real-time values with considerably higher
resolutions than given by historical values.
6.
Specify the displayed period of time for the selection of measured values. Real-
time measured values are only available for the current day.
7.
At selection of "Show diagram", the configuration will close and the diagram view is
displayed.
Summary of Contents for blue'Log X Series
Page 1: ...blue Log X series X 1000 X 3000 Operating manual Version 20150201...
Page 54: ...52 52 blue Log X series...
Page 55: ......


