Power and Voltage Quality Trainer
AD 2
– MI 3399
147
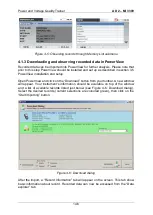
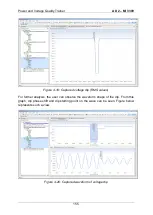
Figure 4-7: General logging information
Double click (or single click on
⊞
sign) on the “U/I/f” option, then double click “Current”.
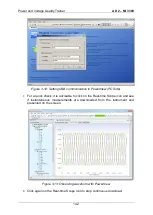
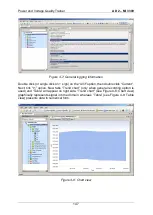
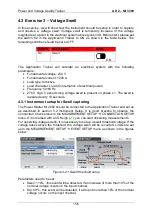
Next, tick “I1” option. New tabs “Trend chart” (only when general recording option is
used) and “Table” will appear on right side. “Trend chart” (see Figure 4-8: Chart view)
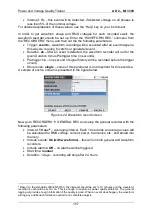
graphically represents signal in time domain, whereas “Table” (see Figure 4-9: Table
view) presents data in numerical form.
Figure 4-8: Chart view
Summary of Contents for MI 3399
Page 27: ...Electrical Installation Safety Trainer AD 1 MI 3399 27...
Page 46: ...Electrical Installation Safety Trainer AD 1 MI 3399 46 3 Exit settings...
Page 74: ...Electrical Installation Safety Trainer AD 1 MI 3399 74...
Page 197: ...Power and Voltage Quality Trainer AD 2 MI 3399 197 Figure 4 89 Transient Chart view...
Page 204: ...PAT Appliances Machines Safety Trainer AD 3 MI 3399 204...
Page 249: ...PV Photovoltaic Systems Trainer AD 4 MI 3399 249...
Page 250: ...PV Photovoltaic Systems Trainer AD 4 MI 3399 250 AD 4 MI 3399 PV Photovoltaic Systems Trainer...

