Power and Voltage Quality Trainer
AD 2
– MI 3399
162
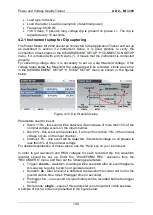
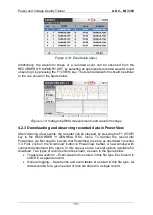
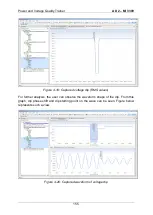
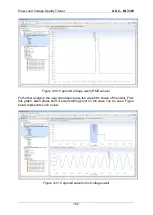
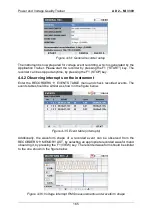
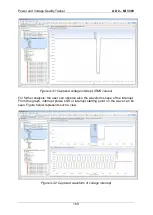
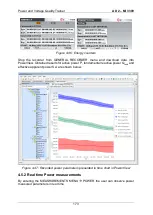
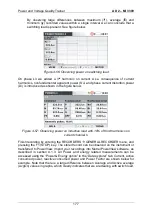
Figure 4-30: Captured voltage swell (RMS values)
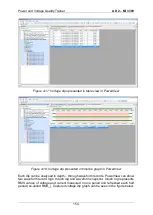
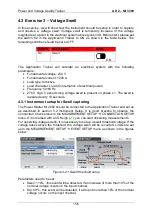
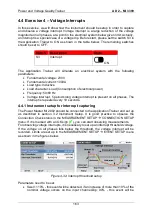
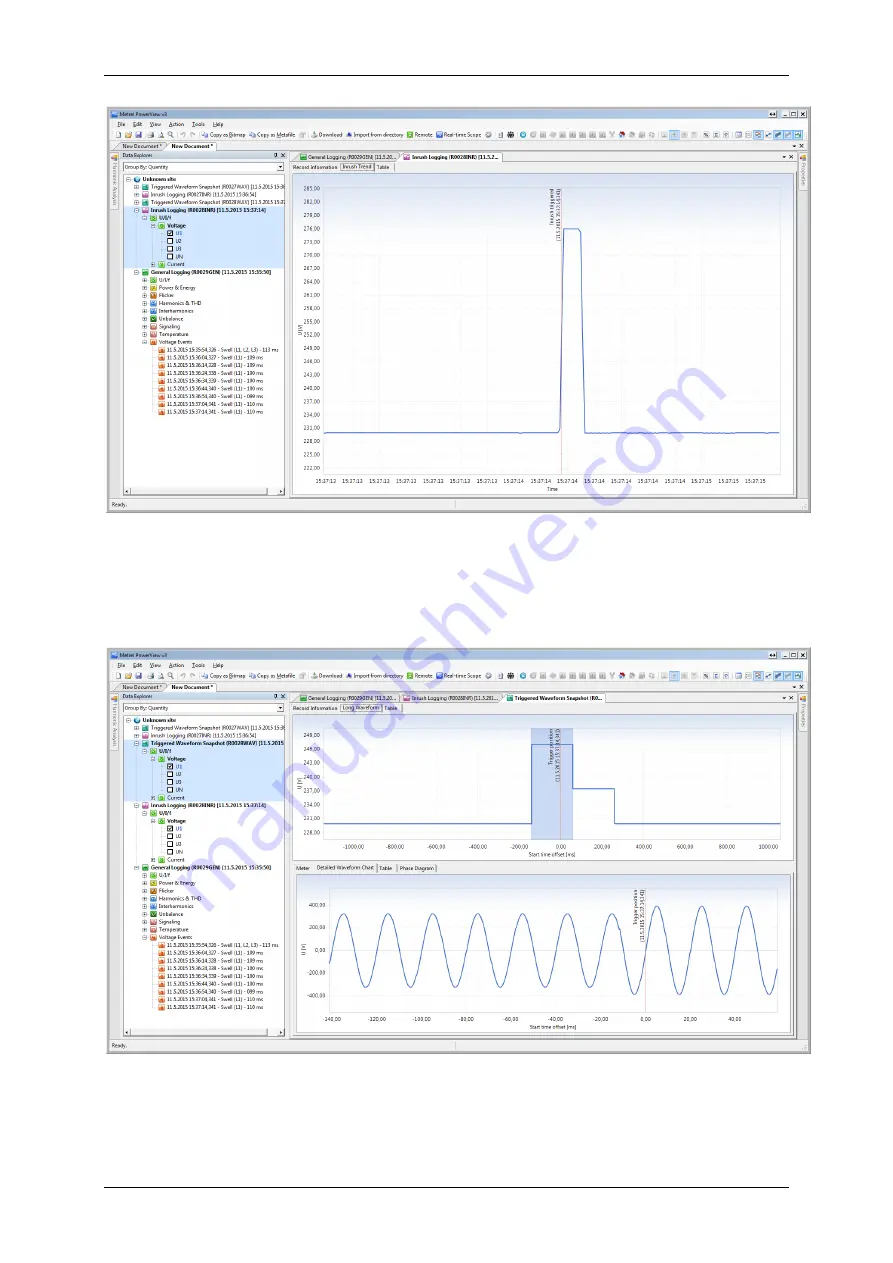
For further analysis, the user can observe also the waveform shape of the swell. From
this graph, swell phase shift or swell starting point on the wave can be seen. Figure
below represents such a view.
Figure 4-31: Captured waveform of voltage swell
Summary of Contents for MI 3399
Page 27: ...Electrical Installation Safety Trainer AD 1 MI 3399 27...
Page 46: ...Electrical Installation Safety Trainer AD 1 MI 3399 46 3 Exit settings...
Page 74: ...Electrical Installation Safety Trainer AD 1 MI 3399 74...
Page 197: ...Power and Voltage Quality Trainer AD 2 MI 3399 197 Figure 4 89 Transient Chart view...
Page 204: ...PAT Appliances Machines Safety Trainer AD 3 MI 3399 204...
Page 249: ...PV Photovoltaic Systems Trainer AD 4 MI 3399 249...
Page 250: ...PV Photovoltaic Systems Trainer AD 4 MI 3399 250 AD 4 MI 3399 PV Photovoltaic Systems Trainer...


