MetriCorr
VL100 & MasterLink Operation Manual
32 | 45
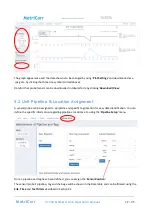
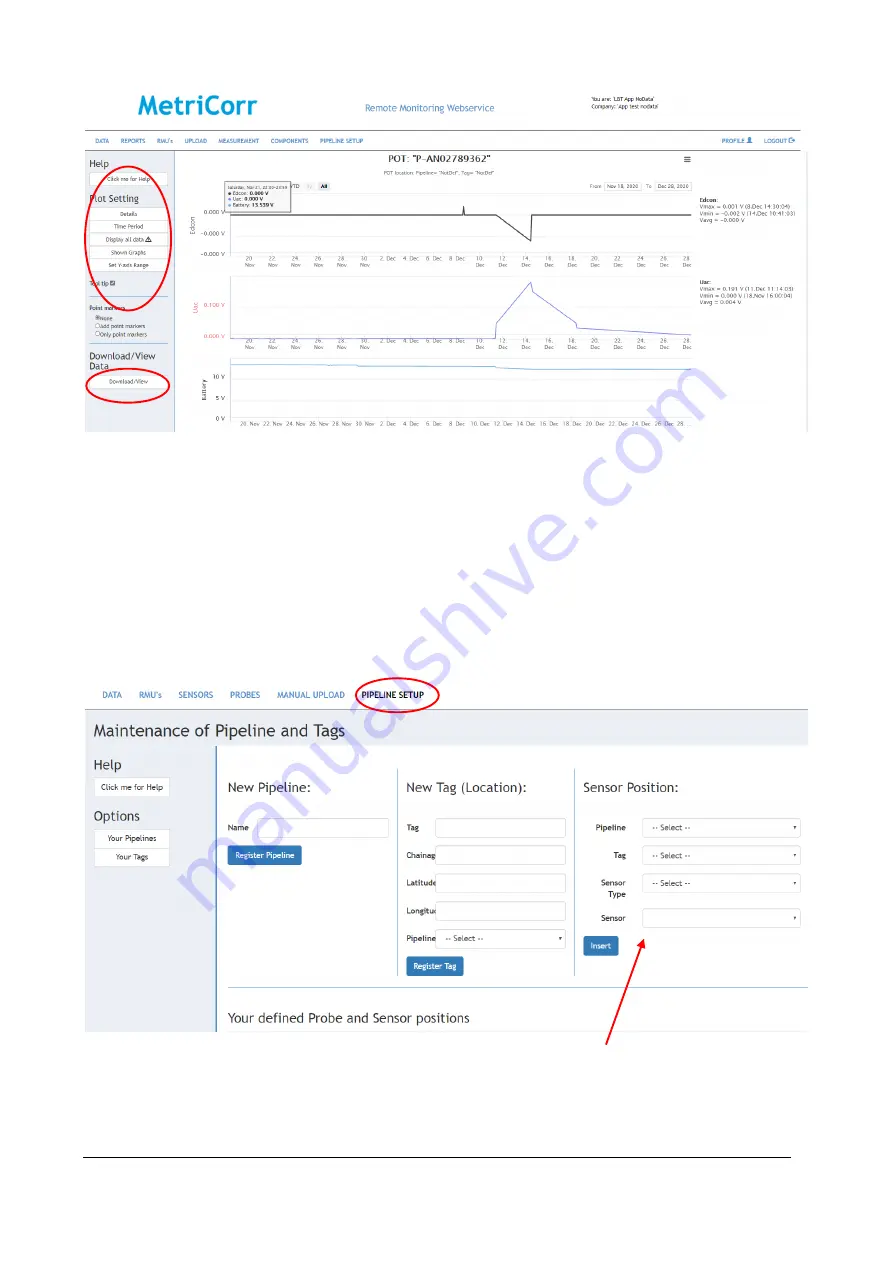
The graph appearance and the data shown can be changed by using '
Plot Settings
' and downloaded as a
.jpeg etc. by clicking the three-line symbol (circled above).
Data for that probe/sensor can be downloaded in tabular form by clicking '
Download/View
'.
5.2
Unit Pipeline & Location Assignment
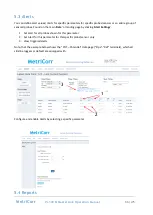
A sensor/probe can be assigned to a pipeline and specific tag/location for easy data identification. You can
define the specific information regarding pipelines, locations etc. using the '
Pipeline Setup
' menu.
Once a pipeline and tag have been defined, you can assign the '
Sensor
Position'
.
The sensor/probe's pipeline, tag and chainage will be shown in the Data table and can be filtered using the
Site
,
Time
and
Text
filters
described in Section 6.1.

