background image


19 

7.10  Pulse outputs  

(either pulse outputs or pulse inputs on F2)


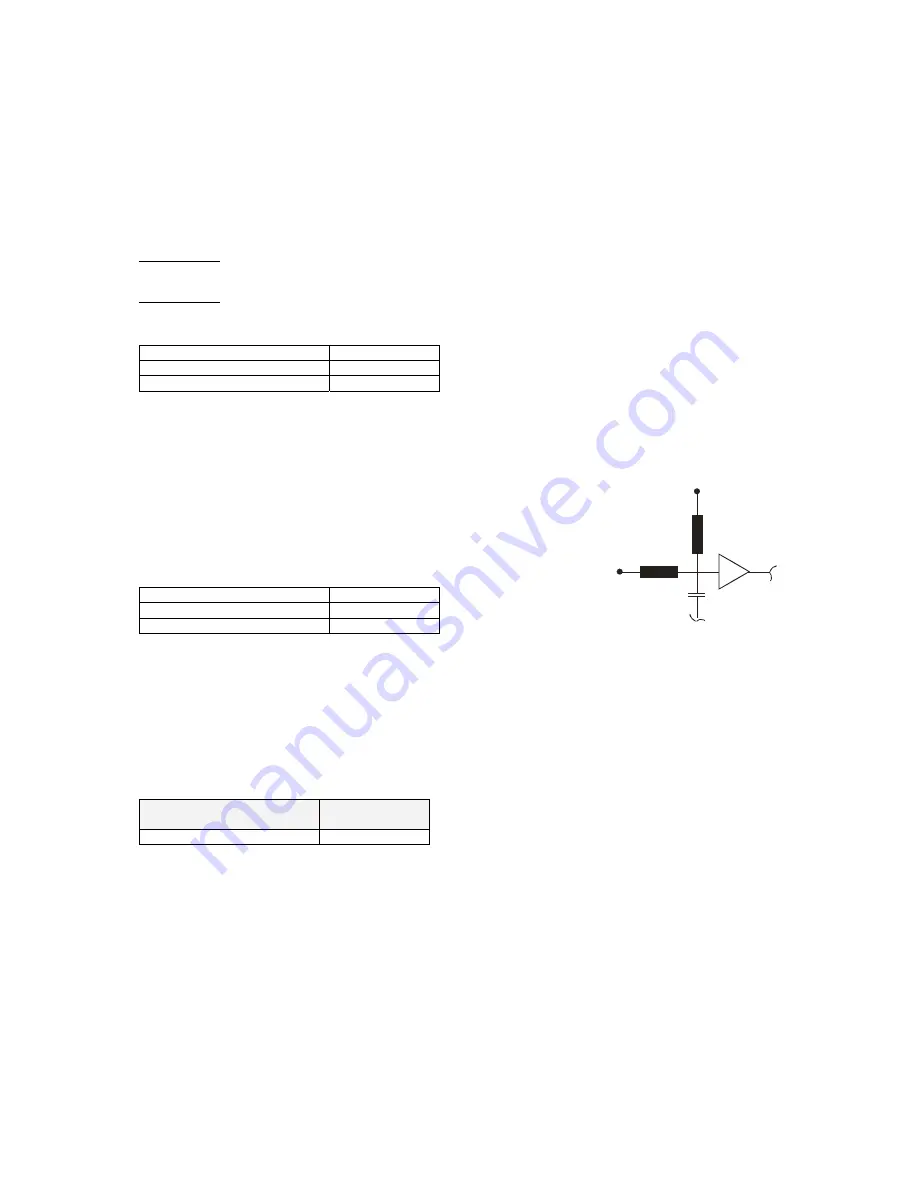
F2 can be equipped with two pulse outputs as standard of the type “Open collector” for 
energy (pulse output 1) and volume (pulse output 2). 

The last digit and the energy unit will reveal the pulse weight of the pulses. Example: 
sequence “10” (energy) on display is shown “1001.01” MWh => pulse weight = 0.01 
MWh/pulse. 

Pulse output 1 
Energy; one (1) pulse for each update of the last digit in the energy register (seq. “10”). 

Pulse output 2 
Volume, one (1) pulse for each update of the last digit in the flow register (seq. “11”). 


Pulse value 

[ms] 

250 

Voltage 

[V] 

3 – 30  

Maximum current 

[µA] 

20 

Table 7.10, Pulse output data 


7.11 Pulse inputs 

(either pulse outputs or pulse inputs on F2)


F2 is equipped with two pulse inputs as standard. The pulse inputs can be 
used for measuring of other meter with pulse outputs, such as cold and hot 
water meters, gas, electricity meters and other meters. The pulse inputs can 
be set as volume registers. These registers accumulate the pulses into two 
volume registers with the value [m3]. 

Frequency [Hz] 

12 

Min. pulse duration  

[ms] 

40 

Max. Voltage 

[V] 

Table 7.11, Pulse inputs 


7.12 Alarm output 

The F2 is equipped with one alarm output as standard of the type “Open collector”. The 
alarm output sends a pulse every hour as long as an error code exists. The pulse duration 
250 [ms] for pulse and alarm output can be altered using the “Service program” version 
2 or higher in 125 [ms] steps. 

Alarm frequency when an 
error exists 

Once every hour 

Pulse width 

[ms] 

250 

Table 7.12, Alarm output 


+ 3V

Fig. 7.11, Pulse output 

Summary of Contents for SVM F2

Page 1: ...SVM F2 Calculator A small competent calculator for compact or wall montage Users manual...

Page 2: ......

Page 3: ...CALCULATOR 15 6 SEALS 16 7 TECHNICAL DATA 17 7 1 POWER SUPPLY 17 7 2 TEMPERATURE SENSORS 17 7 3 FLOW SENSORS 17 7 4 TEMPERATURE RANGE 17 7 5 AMBIENT TEMPERATURE TEMPERATURE CLASS 17 7 6 FLOW SENSOR PL...

Page 4: ......

Page 5: ...icate that the meter has left transport mode no on the display extinguishes and is replaced by 00 service mode 2 Operating mode If so ordered the F2 calculator is set to enter the operating mode direc...

Page 6: ...or 11 0 Flow sensor 5 F High temperature sensor H 6 F High temperature sensor H 7 R Low temperature sensor L 8 R Low temperature sensor L 16 P1 Pulse input output 1 17 19 0 Pulse input output 1 and 2...

Page 7: ...fixating the adapter 2 Guide rails 3 Adapter 2 2 Lead through F2 has six holes for connecting cables To obtain the environmental class it is vital that the diameter of cables is of the following sizes...

Page 8: ...5 Momentary values Momentary power display sequence 20 and momentary flow display sequence 21 are calculated as follows As long as the time between the flow sensor pulses is longer than four seconds...

Page 9: ...t starts to increment Release the button at the required sequence Change of values in the selected sequence takes place as described above If no button depression occurs during a predetermined period...

Page 10: ...ly registers3 Accumulated volume pulse input 2 m3 46 Possible error code at time of storage of monthly register 47 Possible accumulated error time at the time of storage Minutes 4x Following monthly r...

Page 11: ...2 Short circuit in low temperature sensor L 0004 Break in high temperature sensor H 0008 Short circuit in high temperature sensor H 0005 Error code combination 0001 0004 000A Error code combination 00...

Page 12: ......
Page 13: ...s necessary to proceed to date before leaving the service mode Manoeuvre in service sequence and changing values By pushing the display button the value for the blinking digit can be altered To chang...

Page 14: ...e sequence table Table 4 1 Service sequence hh hour mm minute YY Year MM month DD Day Note The display sequence in the Service mode may vary depending on calculator configuration Service sequence Desc...

Page 15: ...ses via the HF output k is the energy factor kWh C m3 and dt is the difference between simulated flow and return temperatures Example Rf 138 50 100 00 C Rr 127 07 70 00 C dt 30 00 C k 1 141 gives 100...

Page 16: ...16 6 Seals 1 Service seals 2 Test seal 3 Electronic seal 4 Installation seals SVM SVM SVM SVM SVM 1 2 3 4 Fig 6 Sticker seals...

Page 17: ...e 7 2 Cable areas for Pt100 7 3 Flow sensors Flow sensor with pulse output Max frequency Hz 12 Pulse value range l p 0 0001 9999 Min pulse length ms 40 Max voltage V 3 Max cable length m 15 Table 7 3...

Page 18: ...3 25 0 33 0 250 0 330 0 Table 7 7 maximum power at pulse values 7 8 Dynamic behaviour Measurements are undertaken for each flow sensor pulse provided the time between the pulses is five 5 seconds or l...

Page 19: ...lse outputs or pulse inputs on F2 F2 is equipped with two pulse inputs as standard The pulse inputs can be used for measuring of other meter with pulse outputs such as cold and hot water meters gas el...

Page 20: ...J m KWh MBTU kW m h m 1 0 0 001 0 001 0 001 0 1 0 001 0 01 0 001 0 001 10 0 01 0 01 0 01 1 0 01 0 1 0 01 0 01 100 0 1 0 1 0 1 0 1 1 0 1 0 1 1000 1 1 1 1 1 1 1 2 5 0 001 0 01 0 01 0 1 0 01 0 01 0 001 0...

Page 21: ...p dec 1 E Pulse Inputs 250 l p dec 0 E S Pulse Inputs 1 l p dec 3 F 1 Pulse Inputs 10 l p dec 2 F 2 Pulse Inputs 100 l p dec 1 F 3 Pulse Inputs 1000 l p dec 0 F 5 Pulse Outputs F 6 Backlight on displa...

Page 22: ...11 X Monthly values3 accumulated volume 22 X Account days same as monthly values see above X High resolution energy High resolution volume 11 X High resolution volume 22 X X Relevant error code X X A...

Page 23: ...AB www metrima se info metrima se Norra Stationsgatan 93 SE 113 64 Stockholm Phone 46 8 23 60 30 Fax 46 8 23 60 31 Metrima AB Stockholm Sweden Created 2003 11 07 Av Johan Tsung Rev Date 2007 09 03 Rev...

Reviews: