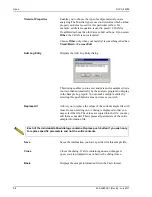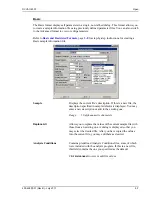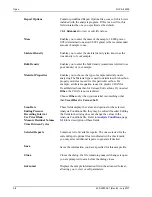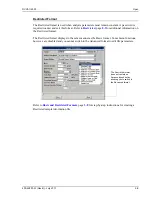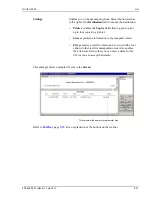
Open
DVVA II 4000
5-20
400-42803-01 (Rev B) - July 2017
Trend Plots
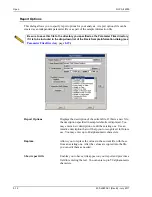
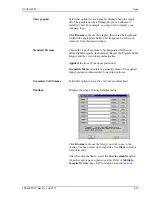
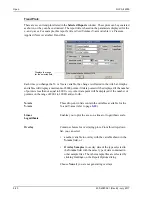
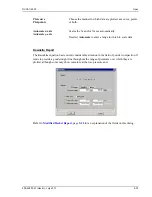
There are seven trend plots listed in the
Selected Reports
window. These plots can be generated
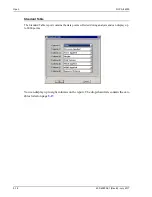
as shown, or they can be customized. The report title is based on the parameters displayed for the
x- and y-axes. For example, this report’s title is Void Volume (Y-axis variable) vs. Pressure
Applied (X-Axis variable) Trend Plot.
Each time you change the X- or Y-axis variable, the change is reflected in the title bar. Graphs
and tables will display a maximum of 8000 points.
All
data points will be displayed if the number
of points is less than or equal to 8000;
every other
data point will be displayed if the number of
points is in the range of 8001 to 16000; and so forth.
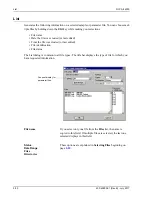
X-Axis
Y-Axis
These drop-down lists contain the variables available for the
X- and Y-axes (refer to page
5-18
).
Linear
Logarithmic
Enables you to plot the axes on a linear or logarithmic scale.
Overlay
Contains choices for overlaying plots. From this drop-down
list, you can select:
•
another variable to overlay with the variable shown in the
Y-Axis
field, or
•
Overlay Samples
to overlay data of the type selected in
the
Y-Axis
field with the same type of data contained in
other sample files. The other sample files are selected by
clicking
Overlays
on the Report Options dialog.
Choose
None
if you are not generating overlays.
Displays the range
for the selected field.
Summary of Contents for DVVA II 4000
Page 1: ...DVVA II 4000 Dynamic Void Volume Analyzer Operator s Manual Rev B 400 42803 01 July 2017 ...
Page 4: ......
Page 10: ...Table of Contents DV VA II 4000 vi 400 42803 01 Rev B July 2017 ...
Page 16: ......
Page 32: ......
Page 116: ......
Page 136: ......
Page 160: ......
Page 180: ......
Page 212: ......
Page 214: ......
Page 240: ......
Page 246: ......
Page 248: ......

