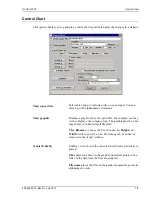
Control Chart
DVVA II 4000
7-10
400-42803-01 (Rev B) - July 2017
X-axis Order By
(
continued
)
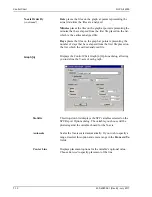
Date
places the files on the graph at points representing the
actual date/time the files are analyzed.
Minutes
places the files on the graph at points representing the
minutes that have elapsed from the first file placed on the list,
which is the earliest-analyzed file.
Days
places the files on the graph at points representing the
number of days that have elapsed from the first file placed on
the list, which the earliest-analyzed file.
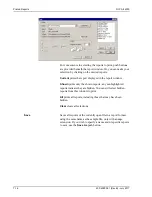
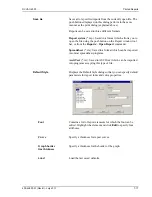
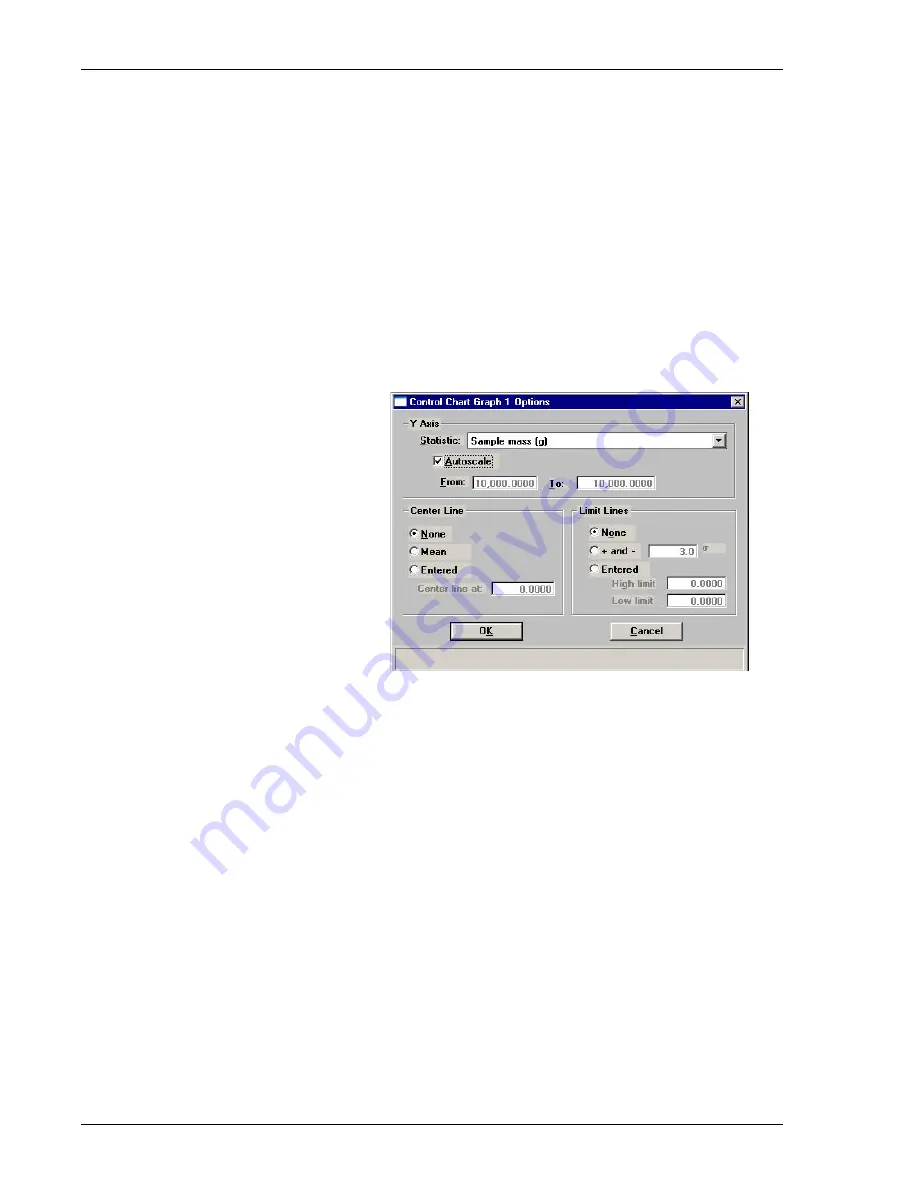
Graph [n]
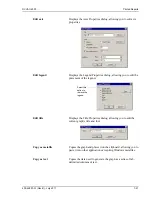
Displays the Control Chart Graph [n] Options dialog, allowing
you to define the Y-axis of each graph.
Statistic
This drop-down list displays the SPC variables selected on the
SPC Report Options dialog. The variable you choose will be
plotted against the variable chosen for the X-axis.
Autoscale
Scales the Y-axis scaled automatically. If you wish to specify a
range, deselect this option and enter a range in the
From
and
To
fields.
Center Line
Displays placement options for the variable’s optional value.
Choose
Entered
to specify placement of the line.
Summary of Contents for DVVA II 4000
Page 1: ...DVVA II 4000 Dynamic Void Volume Analyzer Operator s Manual Rev B 400 42803 01 July 2017 ...
Page 4: ......
Page 10: ...Table of Contents DV VA II 4000 vi 400 42803 01 Rev B July 2017 ...
Page 16: ......
Page 32: ......
Page 116: ......
Page 136: ......
Page 160: ......
Page 180: ......
Page 212: ......
Page 214: ......
Page 240: ......
Page 246: ......
Page 248: ......


