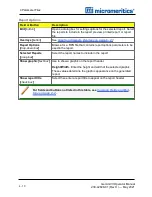


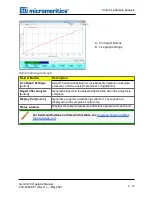

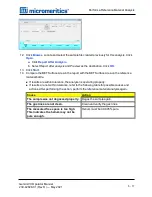


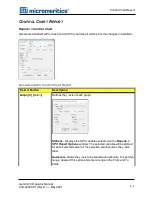
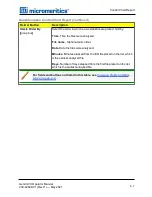
A. Port report buttons
B. Live graph settings
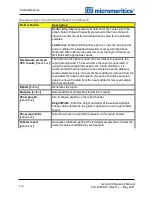
Field or Button
Description
Live Graph Settings
[
button
]
Select Thermal transpiration, x-axis Quantity (relative or absolute
pressure), and the x-axis Scale (linear or logarithmic).
Report after analysis
[
button
]
Generates reports to the selected destination when the analysis is
complete.
Display Port [
button
]
Generates a report on data being collected . The reports are
displayed on the computer monitor only.
Status window
Displays the last point pressure and relative pressure for each port.
For fields and buttons not listed in this table, see
.
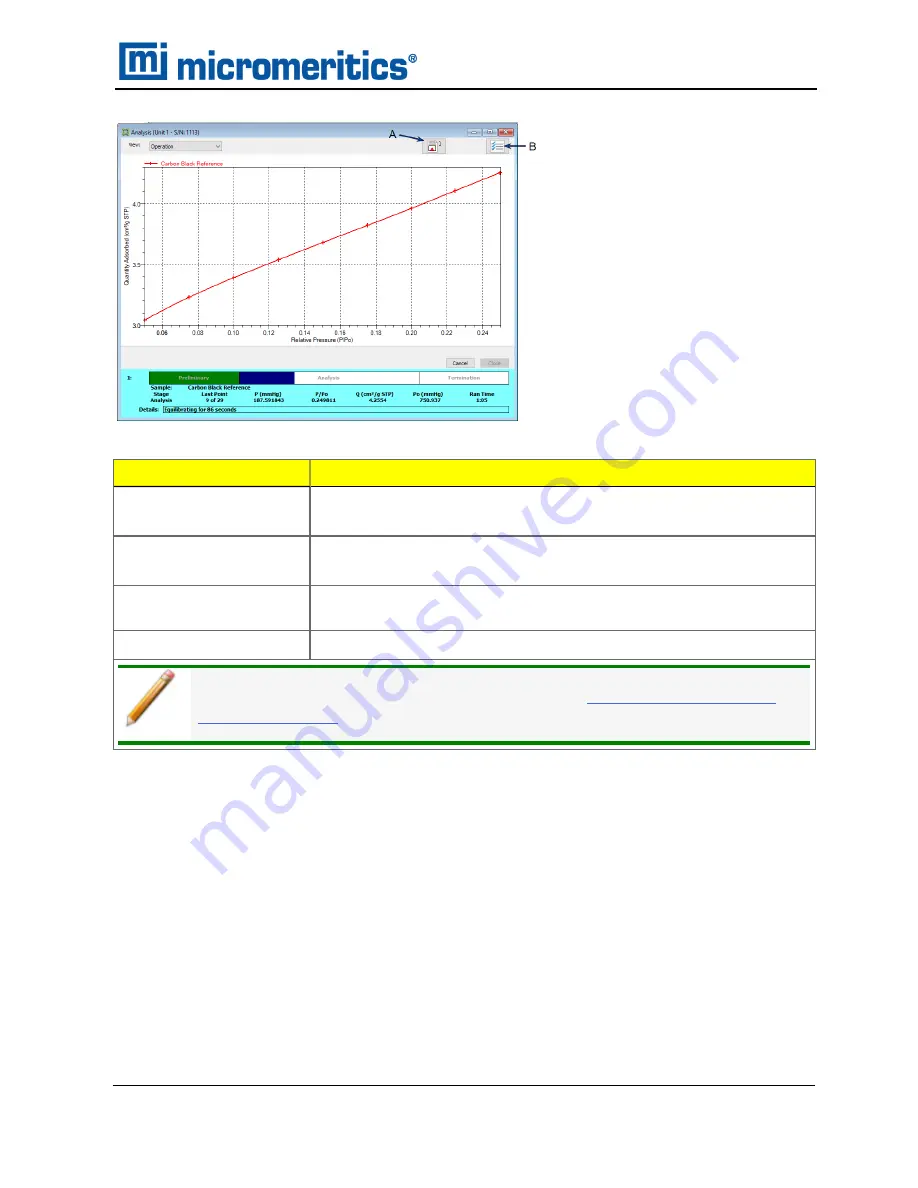
Sample Analysis Graph
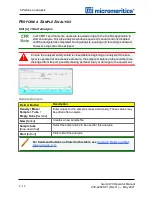
Perform a Sample Analysis
Gemini VII Operator Manual
239-42828-01 (Rev H ) — May 2021
5 - 13
Summary of Contents for GEMINI VII
Page 1: ...OPERATOR MANUAL 239 42828 01 May 2021 Rev H GEMINI VII SURFACE AREA ANALYZER ...
Page 10: ......
Page 16: ......
Page 92: ......
Page 126: ...6 About Reports SAMPLE LOG REPORT 6 34 Gemini VII Operator Manual 239 42828 01 Rev H May 2021 ...
Page 127: ...T PLOT REPORT t Plot Report Gemini VII Operator Manual 239 42828 01 Rev H May 2021 6 35 ...
Page 128: ...6 About Reports VALIDATION REPORT 6 36 Gemini VII Operator Manual 239 42828 01 Rev H May 2021 ...
Page 234: ......
Page 242: ......
Page 244: ......
Page 247: ......
Page 248: ......