Chapter 9 User interfaces
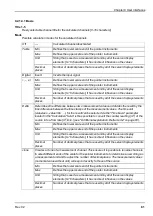
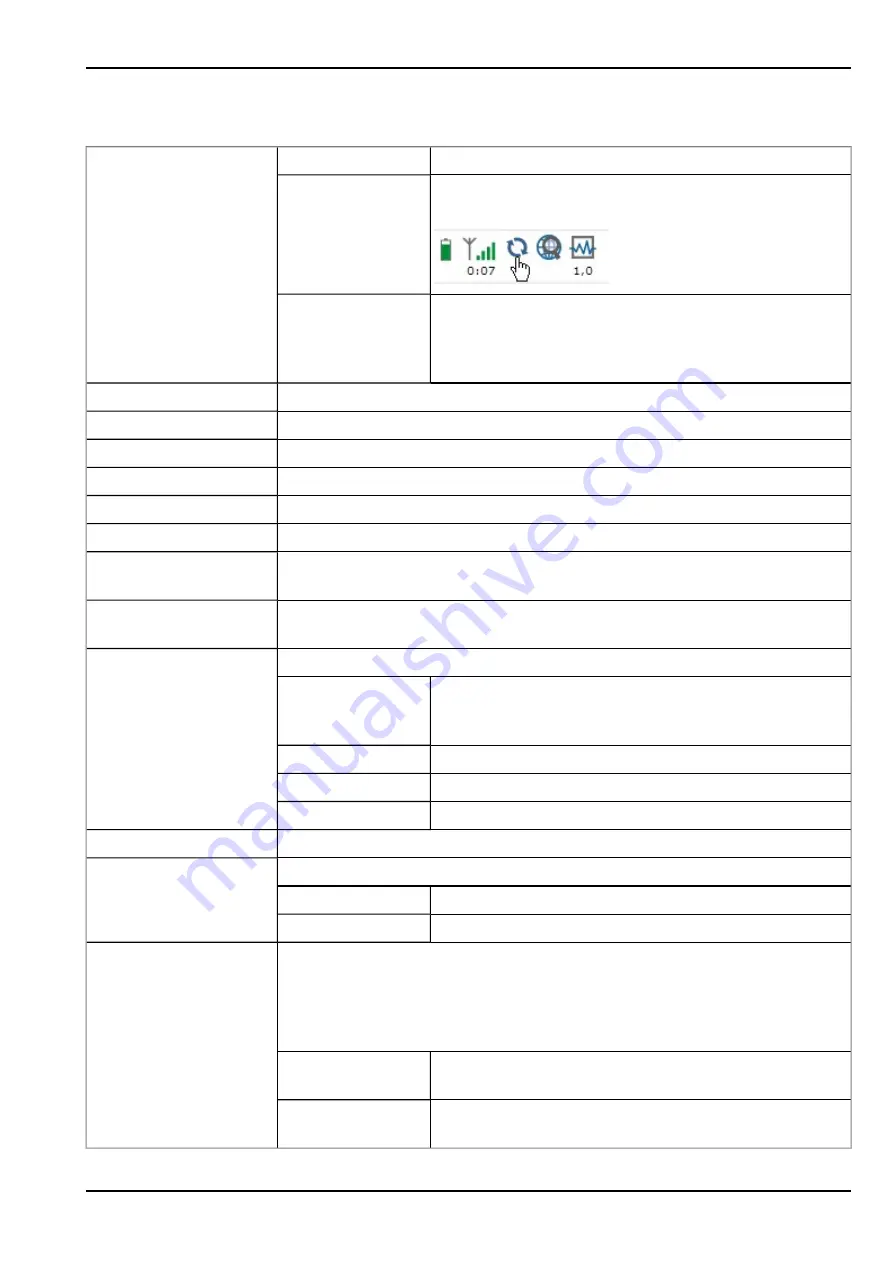
9.2.1.8 Basic setting
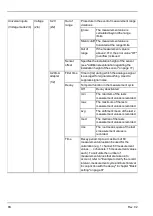
Connection type
Interval
The device connects in the transmission cycle.
Interval & wakeup
The device connects in the transmission cycle and can be
placed into ALOHA transmission mode via the server.
online
The device does not disconnect the connection and
continuously transmits the measurement data. However,
every 7 days, the connection is temporarily interrupted in
order to verify the server assignment.
Aloha/wakeup duration
Duration of the Aloha/wakeup connection
Transmission cycle
Time between transmissions
Record interval
Time between measurement data recordings
Measure quick divisor
Record interval = record interval / factor (from triggering)
Measure slow factor
Record interval = record interval * factor (from triggering)
Measurement cycle
Time between measurements (00:00 same as record interval)
Burst interval
Period of time, during which measurement intervals are used for measuring,
before recording begins (00:00 measurement cycle is permanently activated)
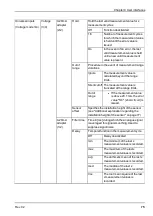
Time zone
Regional settings (not relevant for raw measurement data as this is stored in
UTC)
Daylight saving time
Configuration for automatic time adjustment
Standard
The configuration for the time adjustment is adopted by the
global server setting (see "myDatanet Server Manual
" 805002).
Off
Automatic time adjustment deactivated
USA
Predefined setting for the American area
EU
Predefined setting for the European area
Position cycle
Position update interval (00:00 positioning is completed with every connection)
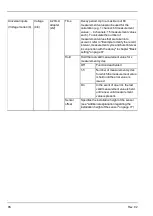
Default report
Selection of the report that is loaded by clicking on the device link in the maps
Off
The default graphic is loaded.
"Name of a report"
The selected report is loaded.
Report template
Selection of whether the default graphic or a report template to display the data is
used when clicking on the symbol to display the measurement data located in the
site/application list. Only the report templates in which the site/application type of
the first wild card is compatible with the site/application that is currently being
edited are displayed in the dropdown list.
(not assigned)
The default graphic is used to display the measurement
data.
"Name of a report
template"
Name of the report template used to display the
measurement data
Rev. 02
87
Summary of Contents for myDatalogNANO
Page 2: ......
Page 8: ......
Page 9: ...Chapter 2 Declaration of conformity Chapter 2 Declaration of conformity Rev 02 9 ...
Page 10: ......
Page 12: ......
Page 22: ......
Page 34: ......
Page 38: ......
Page 58: ......
Page 92: ......
Page 108: ......
Page 118: ......
Page 120: ......
Page 126: ......
Page 130: ......


