background image


12 

Session statistics 

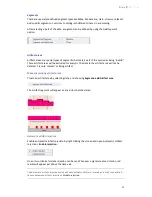
Right click the 

Session Overview 

screen and choose Compute statistics: > 

On entire session


or > 

On all segments

.  


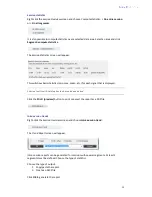
It is also possible to compute statistics over a selected data area. Select an area and click 

Segment: compute statistics


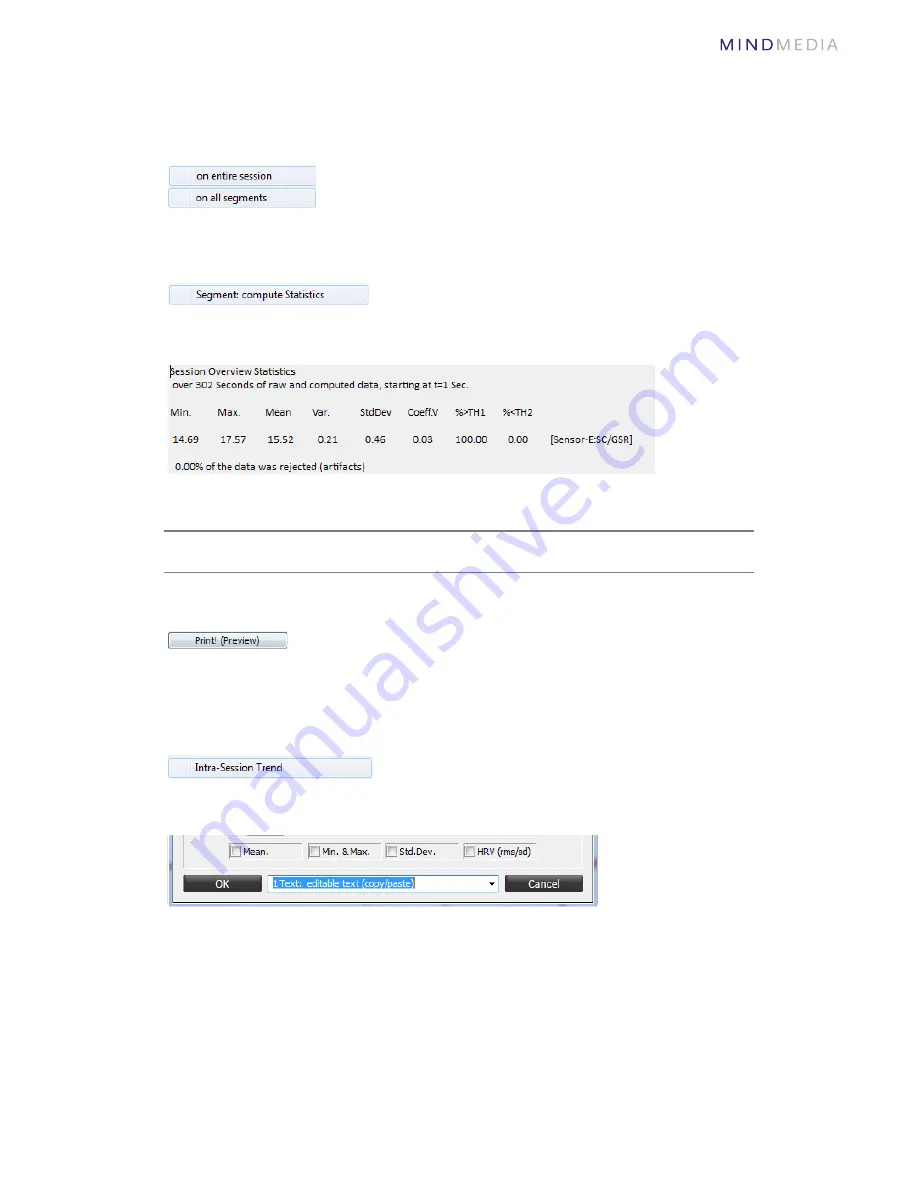
The 

Session Statistics 

screen will appear. 


This will show basic statistics (min, max, mean, etc.) for each signal that is displayed. 


Selected text from this dialog box can be copied and pasted. 


Click the 

Print! (preview)

 button to print or export the report as a PDF file. 


Intra-session trends 

Right-click the 

Session Overview

 screen and choose 

Intra-session trend


The 

Trend Report

 screen will appear. 


Intra-session reports can be generated for sessions with several segments. At least 2 

segments must be defined. Choose the type of statistics. 


Choose the type of output: 

1.


Copy/paste the report. 

2.


Create an ASCII file. 


Click 

OK

 to generate the report. 


Summary of Contents for NeXus-10 MKII

Page 1: ...Quick Start NeXus 10 MKII Version 1 0...

Page 2: ...on 6 Select a training screen 6 Screen controls 6 Connect sensors and check signal quality 7 Start a recording 7 Client feedback 8 Select type of feedback 8 Set thresholds 8 Score controls 9 Review An...

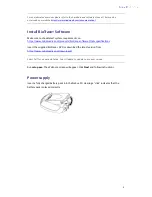
Page 3: ...com products biotrace software tab specifications Insert the supplied BioTrace DVD or download the latest version from https www mindmedia com downloads Select Full for a new installation Select Updat...

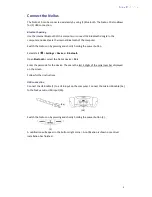
Page 4: ...utton Select Start Settings Devices Bluetooth Open Bluetooth select the NeXus device Pair Enter the passcode for the device These are the last 4 digits of the serial number displayed on the screen Fol...

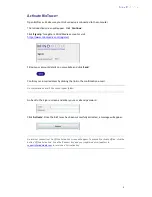
Page 5: ...ur e mail address by clicking the link in the confirmation e mail No confirmation e mail Check your Spam folder Go back to the Sign in screen and enter your e mail and password Click Activate Once the...

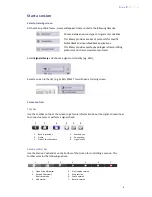
Page 6: ...G Select a screen in the list e g 1x EEG SMR This will open a training screen Screen controls Tool bar Use the Toolbar on top of the screen to get more information about the signal to learn how to con...

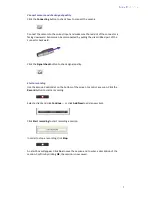
Page 7: ...ick the Signal check button to check signal quality Start a recording Use the Session Control Bar on the bottom of the screen to control a session Click the Record button to start a recording Select a...

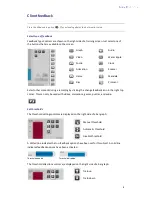
Page 8: ...be used with videos animations games puzzles and audio Set thresholds The threshold setting controls are displayed on the right side of a bar graph A dotted line indicates that no feedback options hav...

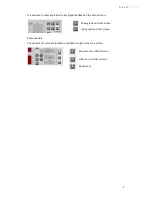
Page 9: ...ph feedback on the client screen Score controls The controls for score are located in the bottom right corner of a screen Show graph on client screen Hide graph on client screen Show score on client s...

Page 10: ...per left corner and choose save screen Selecting and zooming data Select data by clicking the left mouse button on the time axis and dragging the mouse to the left or right When releasing the mouse bu...

Page 11: ...ll not be deleted it is only marked as being artifact Manually marking artifact areas Create an artifact area by selecting data and choosing Segment add Artifact area The artifact segment will appear...

Page 12: ...or each signal that is displayed Selected text from this dialog box can be copied and pasted Click the Print preview button to print or export the report as a PDF file Intra session trends Right click...

Reviews: