Using the QC Programs
8-12
“
Diff
” – standard deviation of the saved analysis results, as the equation below defines,
(
)
1
2
−
∑
−
=
n
Mean
i
X
Diff
where
n
represents how many times the QC program has been run and
X
i
is the result
acquired from every QC analysis and “
Mean
” is the mean value derived from the first
equation.
“
CV
” – Coefficient of Variation, as the equation below defines
%
100
×
=
Mean
Diff
CV
where
Mean
is the mean value derived from the first equation and
Diff
is the standard
deviation derived from the second equation.
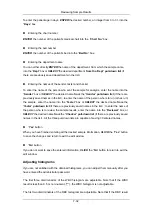
Every point in the graph is interpreted as follows:
The darkened square
■
that falls between the upper and the lower dash lines is within the
control range. Otherwise, it is not. The blank square
□
represents the QC analysis either ran
into errors or is out of the display range.
If you see any points fallen outside the control range, do the following steps until the problem
is solved. If all the steps have failed, contact Mindray customer service department or your
local distributor for assistance.
1. Check the lower left corner of the screen for error messages. Refer to
Chapter 11
Troubleshooting Your Analyzer
for solutions to any displayed error messages;
2. Check the L-J settings for inappropriate entries;
3. Do the background check. In case of an abnormal background result, refer to
Chapter 11
Troubleshooting Your Analyzer
for solutions;
4. Re-run the control;
5. Run another vial of control;
6. Check if the analyzer needs to be calibrated.
Other
operations:
To print out the currently displayed L-J graph, press [PRINT]. To acquire help information,
press [HELP]. To return to the ”
Controls
” screen, press [MENU]
QC Table
At the “
Controls
” screen, press [F5] to enter the “
QC Table
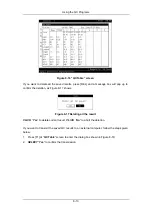
” screen, as Figure 8-16 shows,
where every screen displays the results of 6 QC analyses. You can press [PgUp] or [PgDn] to
switch to the previous or next screen to view other results.
Summary of Contents for BC-2800
Page 1: ...BC 2800 Auto Hematology Analyzer Operator s Manual ...
Page 2: ......
Page 12: ......
Page 24: ...Using This Manual 1 12 Figure 1 4 High voltage warning label 7 High Voltage 7 ...
Page 62: ......
Page 91: ...Customizing the Analyzer Software 5 29 Figure 5 46 Saving changes ...
Page 92: ......
Page 170: ...Using the QC Programs 8 14 Figure 8 18 Transmission dialog box ...
Page 196: ......
Page 248: ......
Page 252: ......
Page 266: ......
Page 284: ...Appendices E 10 Hemoglobin Concentration ...
Page 286: ...P N 2800 20 28795 2 0 ...


