6 Image Acquisition
Operator’s Manual
6 - 37
Apart from TDI imaging function, the system also provides smart tissue tracking QA function for
myocardial movement evaluation.
By smart tissue tracking QA function, the ultrasound system will scan each pixel position by frame
within the cardiac cycle, and then use region matching method and auto-correlation searching
method to trace each spot and calculate the movement, so as to determine myocardial motion in a
more quantitative way.
NOTE:
Only use the probes that support stress echo function under the cardiac mode to start Smart TTQA
function.
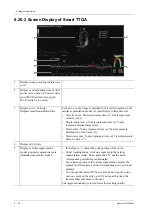
6.20.1 Basic Procedures for Smart TTQA
Perform the following procedure:
1.
Open a saved B mode cardiac cine file.
A cin. format file which contains more than 1 cardiac cycle (with 2 R waves) and ECG signal.
2.
Tap [Smart] > [Smart TTQA] or press the user-defined key to activate the function:
–
You can determine the image of interest by previewing the image.
–
Use [Cycle] to select and find the image of interest.
NOTE:
If any section of the long axis (ALAX, A4C, and A2C) is not automatically recognized, select
a section manually.
3.
Select the corresponding section name and locate one frame image with good image effect by
cine play. Use the cursor to set the reference point:
–
Long axis section: use the “3-point” method, “Auto” or “Manual” method to set.
–
Short axis section: enter multiple points (at least 6 points) using the cursor manually to
set.
4.
After reference points are set, the system will display the boundary of the endocardium and
epicardium. Adjust the thickness if necessary.
If the traced result is poor, tap [Reload] to re-trace the reference points, or make fine
adjustments to the points using the cursor.
If the cycles are not adequate to provide the information, switch to another cycle to trace.
5.
Tap [Start Tracking] on the soft menu to start the tracking function. Adjust the parameters if
necessary.
Tap [Edit] on the soft menu to display the cursor. Tap the screen to re-select the trace reference
points (inner dots of the curve). Move the cursor to the exact boundary position and tap the
cursor again to set the right place. Tap [Start Tracking] to start tracking again.
6.
Tap [Accept & Compute] to calculate and display the curve.
Adjust the parameters if necessary.
7.
Tap [Bull’s Eye] to see the result.
8.
Tap [Data Export] to export analyzed data.
9.
Tap [Exit] to exit.
Summary of Contents for TE X
Page 2: ......
Page 15: ...Contents Operator s Manual ix I Indications for use I 1...
Page 16: ......
Page 24: ...This page intentionally left blank...
Page 110: ...This page intentionally left blank...
Page 168: ...This page intentionally left blank...
Page 188: ...This page intentionally left blank...
Page 266: ...This page intentionally left blank...
Page 274: ...This page intentionally left blank...
Page 278: ...This page intentionally left blank...
Page 298: ...H 2 Operator s Manual H Probe Dimensions Length Height Max Width Max...
Page 328: ...This page intentionally left blank...
Page 329: ......
Page 330: ...P N 046 023006 00 2 0...

