miniDSP Ltd – Hong Kong /
www.minidsp.com
/ Features and specifications subject to change without prior notice
27
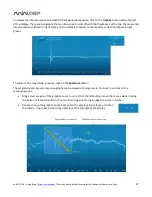
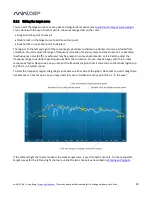
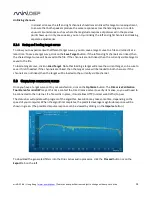
To display the impulse response instead of the magnitude response, click on the Impulse button at the top left
of the display. There are two graphs that can be turned on and off with the checkboxes at the top: the measured
impulse response (shown in light blue), and the predicted impulse response after correction (shown in light
green).
To return to the magnitude response, click on the Spectrum button.
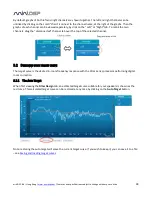
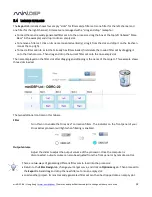
The magnitude and impulse response graphs can be viewed at a larger scale. To zoom in and out on the
response graphs:
Drag-select a region of the graph to zoom in on it. (Click the left button, move the mouse while holding
the button, release the button.) You can then drag-select a region again to zoom in further.
Double-click on the graph to zoom back out to the previous zoom level, or click on
the small “–” sign next to the zoom indicator at the top right of the display.


