16
6.3 Measurement functions
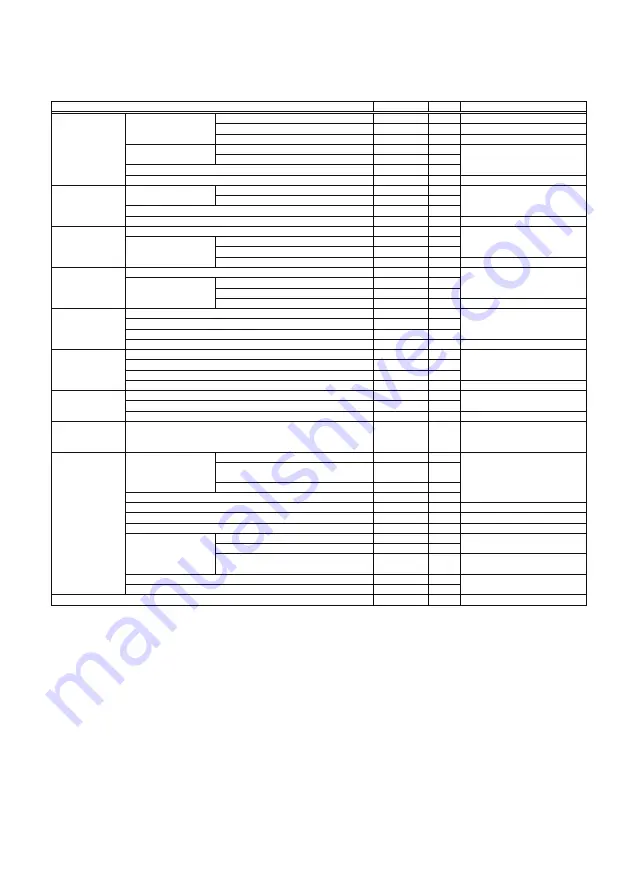
6.3.1 Measurement function list
Measurement elements
Present value
Present demand value
All-phase demand maximum value
Maximum value between all wires
Maximum value occurrence time between all wires
All-phase demand maximum value occurrence time
Present value
Present value
Demand value
Demand value
Demand value
Integrated value
Latest one hour amount
One hour amount maximum value
Occurrence time of one hour amount maximum value
Integrated value
Latest one hour amount
One hour amount maximum value
Occurrence time of one hour amount maximum value
Fundamental frequency maximum value for all phase
Each-order maximum value for all phase
Occurrence time of each-order maximum value for all phase
All-phase each-order content ratio
All-phase total distortion ratio
Occurrence time of fundamental frequency maximum value for all phase
Present value
Maximum value occurrence time
Present value
Present value
Maximum value
Present value
Each-phase fundamental frequency
Each phase, each order (3rd, 5th, 7th,
9th, 11th, 13th, 15th, 17th, 19th order)
Total harmonic for each phase
Each-phase
0.0, 1.2 to 999.9, 1000 to 1600 A
00/01/01 00:00 to 99/12/31 23:59
Total harmonic (average value)
Maximum phase
Each-phase
Total harmonic for each phase
Total harmonic maximum value for all phase
Occurrence time of total harmony
maximum value for all phase
Maximum value occurrence time
Maximum value
Present value
Maximum value occurrence time
Maximum value
Maximum value
Present value
Total harmonic (average value)
Between each line
Communication Display Display rauge
*
●
●
●
●
●
●
●
●
●
●
●
●
●
●
●
●
●
●
●
●
●
●
●
●
●
●
●
●
●
●
●
●
●
●
●
●
●
●
●
●
●
●
●
●
●
●
●
●
●
●
●
●
●
●
●
●
●
●
●
●
●
●
●
●
●
●
●
●
●
●
●
●
●
●
●
●
●
●
●
●
●
●
–
–
–
–
–
–
–
–
The following table lists measurement elements and elements that can be communicated/displayed.
Measurement elements that can be communicated and displayed
I
Load current
(
±
1.0%)
V
Line voltage
(
±
1.0%)
P
Electric power
(
±
1.5%)
Q
Reactive power
(
±
2.5%)
EP
Electric energy
(
±
2.0%)
EQ
Reactive energy
(
±
3.0%)
PF
Power factor
(
±
5.0%)
Hz
Frequency
(
±
2.5%)
IH
Harmonic current
(
±
2.5%)
Fault current (
±
15%)
* The minimum value and the maximum value of the display range differ depending on the rated current of the MDU breaker. For details,
refer to “6.3.2 Measurement rated values/measurement range and accuracy”.
0.0, 1.2 to 999.9, 1000 to 1600 A
00/01/01 00:00 to 99/12/31 23:59
0.0, 22.0 to 99.9, 100 to 759 V
00/01/01 00:00 to 99/12/31 23:59
-2103 to -1000, -999.9 to 999.9,
1000 to 2013 kW
00/01/01 00:00 to 99/12/31 23:59
-2103 to -1000, -999.9 to 999.9,
1000 to 2013 kver
00/01/01 00:00 to 99/12/31 23:59
0.0 to 99999.9 kWh
(
250 A frame
)
0 to 999999 kWh
(
400/800 A frame
)
00/01/01 00:00 to 99/12/31 23:00
0.0 to 99999.9 kverh
(
250 A frame
)
0 to 999999 kverh
(
400/800 A frame
)
00/01/01 00:00 to 99/12/31 23:00
LAG 50.0 to LAG 99.9, 100.0,
LEAD 99.9 to LEAD 50.0%
00/01/01 00:00 to 99/12/31 23:59
0.0, 45.0 to 65.0 Hz
0.0, 2.5 to 99.9, 100 to 800 A
00/01/01 00:00 to 99/12/31 23:59
0.0, 2.5 to 99.9, 100 to 800 A
00/01/01 00:00 to 99/12/31 23:59
0.0, 2.5 to 99.9, 100 to 800 A
0 to 12800 A
0.0 to 99.9, 100%
Summary of Contents for NF400-HEW
Page 55: ......
Page 56: ...LN107A329H02 IB63E31 A 1911 MEE MDU Breakers Nov 2019 ...


