'19 • PAC-DB-333
- 32 -
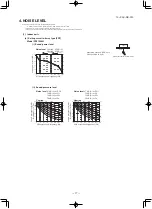
6. TEMPERATURE AND VELOCITY DISTRIBUTION
Indoor temperature
Cooling 27°
CDB / 19°
CWB
Heating 20°
CDB
Note: These figures represent the typical main range of temperature and velocity distribution at the center of air outlet
within the published conditions.
In the actual installation, they may differ from the typical figures under the influence of air temperature conditions,
ceiling height, operation conditions and obstacles.
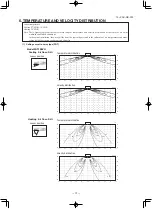
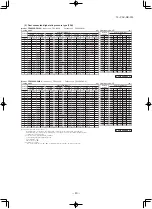
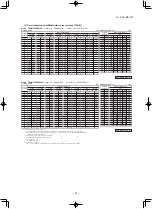
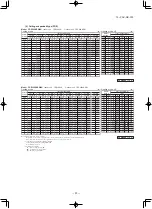
(1) Ceiling cassette-4 way type (FDT)
Model FDT100VH
Cooling Air flow: P-Hi
Louver position
Temperature distribution
24
21
18
15
24
21
18
15
(℃)
5m
4m
3m
2m
1m
0m
5m
4m
3m
2m
1m
0m
5m 4m 3m 2m 1m 0m 1m 2m 3m 4m 5m
20°
Velocity distribution
0.3
0.6
0.3
0.6
5m
4m
3m
2m
1m
0m
5m
4m
3m
2m
1m
0m
5m 4m 3m 2m 1m 0m 1m 2m 3m 4m 5m
(m/sec)
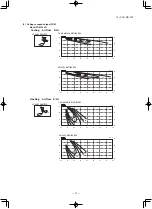
Heating Air flow: P-Hi
Louver position
Temperature distribution
23
29
32
35
26
29
32
35
23
26
5m
4m
3m
2m
1m
0m
5m
4m
3m
2m
1m
0m
5m 4m 3m 2m 1m 0m 1m 2m 3m 4m 5m
(℃)
60°
0.3
0.6
0.9
0.3
0.6
0.9
5m
4m
3m
2m
1m
0m
5m
4m
3m
2m
1m
0m
5m 4m 3m 2m 1m 0m 1m 2m 3m 4m 5m
(m/sec)
Velocity distribution

