Graphic Operation Terminal F940GOT
Creation of Display Screens (FX-PCS-DU/WIN-E) 10
10-33
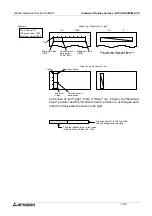
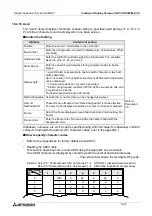
2) Minimum Value and Maximum Value
•
Set the sampling data range to be displayed in the vertical axis.
3) Shown Devices
-
Select the line type for each trend graph.
-
Select the line type for four data registers starting from the one specified in "Word
Device".
None
: Trend graph is not displayed. (Sampling is performed.)
Unbroken : Trend graph is displayed in continuous line (
).
Broken
: Trend graph is displayed in broken line (
).
Dotted
: Trend graph is displayed in dotted line (
).
Dashed
: Trend graph is displayed in alternate long and short dash line (
).
-
A desired color can be assigned to each line.
If the sampling data is larger than the maximum
value or smaller than the minimum value, the
graph is discontinued.
Maximum
Value
Minimum
Value
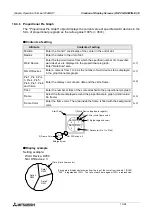
4) Frame Color
Enlarged view
Bg
(background color)
3) Shown Devices
(line type and line color)
Start Point
2) Maximum Value
1) Ticks
Scale Color
2) Minimum Value
Summary of Contents for F940GOT-LWD-E
Page 1: ...OPERATION MANUAL F940GOT SWD E F940GOT LWD E...
Page 4: ...Graphic Operation Terminal F940GOT 2...
Page 6: ...Graphic Operation Terminal F940GOT 4...
Page 8: ...Graphic Operation Terminal F940GOT 6...
Page 14: ...Graphic Operation Terminal F940GOT Contents vi...
Page 104: ...Graphic Operation Terminal F940GOT Alarm Mode 6 6 12...
Page 148: ...Graphic Operation Terminal F940GOT Creation of Display Screens 9 9 30...
Page 228: ...Graphic Operation Terminal F940GOT Changeover of Display Screen FX PCS DU WIN E 11 11 18...


