Graphic Operation Terminal F940GOT
Sampling Mode 5
5-10
5.3
Display of sampling result
The sampling result can be displayed in the form of a list or trend graph.
5.3.1
DISPLAY LIST
The sampling result is displayed in the form of list. Four sets of data are displayed on each
screen.
u
u
u
u
Basic operation
5.3.2
DISPLAY GRAPH
The sampling result is displayed in the form of trend graph.
u
u
u
u
Basic operation
The SAMPLING MODE
screen is displayed.
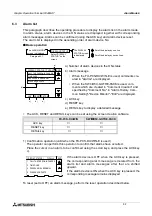
DISPLAY LIST
Paragraph 5.1
Select "DISPLAY LIST".
The screen shown below
is displayed.
:Scroll the display by one line.
:Scroll the display by one screen
(four lines).
Scroll the display
continuously when
pressed and held.
[ DISPLAY LIST ]
END
NUMBER
TIME
c)
b)
a)
1
2
3
4
13:00:00
13:01:00
13:02:00
13:03:00
0 0
0 0
0 0
0 0
0 0
0 0
0 0
0 0
a) NUMBER (Sample number)
b) TIME (time when sampling was performed)
c) Sampling result
The result is displayed in the following order.
D
¡
D
¡
+1
D
¡
+2
D
¡
+3
("
¡
" indicates a data register No. specified in
"SAMPLING DEV.")
The SAMPLING MODE
screen is displayed.
DISPLAY GRAPH
Paragraph 5.1
Select "DISPLAY GRAPH".
The screen shown below is
displayed.
:Scroll the display by one set
of data.
:Scroll the display by ten sets
of data.
Scroll the display
continuously when
pressed and held.
[ DISPLAY GRAPH ]
END
1
10
a)
a) Sampling result
D
¡
D
¡
+1
D
¡
+2
D
¡
+3
("
¡
" indicates a data register No. specified in
"SAMPLING DEV.")
In "DISPLAY GRAPH", values within the range
Summary of Contents for F940GOT-LWD-E
Page 1: ...OPERATION MANUAL F940GOT SWD E F940GOT LWD E...
Page 4: ...Graphic Operation Terminal F940GOT 2...
Page 6: ...Graphic Operation Terminal F940GOT 4...
Page 8: ...Graphic Operation Terminal F940GOT 6...
Page 14: ...Graphic Operation Terminal F940GOT Contents vi...
Page 104: ...Graphic Operation Terminal F940GOT Alarm Mode 6 6 12...
Page 148: ...Graphic Operation Terminal F940GOT Creation of Display Screens 9 9 30...
Page 228: ...Graphic Operation Terminal F940GOT Changeover of Display Screen FX PCS DU WIN E 11 11 18...

