CHAPTER 5: OPERATING INSTRUCTIONS
MODEL 250DP DUAL PULSE
RESISTANCE WELDING POWER SUPPLY
990-280
5-7
Weld Strength Profiles
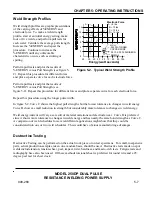
Weld strength profiles are graphic presentations
of the varying effects of %ENERGY and
electrode force. To make a weld strength
profile, start at an initial energy setting, make
four or five welds, and perform pull tests for
each weld. Calculate the average pull strength.
Increase the %ENERGY and repeat the
procedure. Continue to increase the
%ENERGY until any unfavorable
characteristic occurs, such as sticking or
spitting.
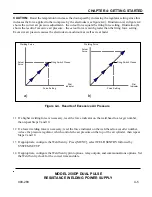
Perform pull tests and plot the results of
%ENERGY versus Pull Strength (see figure 5-
2). Repeat this procedure for different forces
and plot a separate curve for each electrode force.
Perform pull tests and plot the results of
%ENERGY versus Pull Strength (see
figure 5-2). Repeat this procedure for different forces and plot a separate curve for each electrode force.
Repeat this procedure using the longer pulse width.
In figure 5-2, Curve C shows the highest pull strengths but the lowest tolerance to changes in weld energy.
Curve B shows a small reduction in strength but considerably more tolerance to changes in weld energy.
Weld energy/current will vary as a result of material variations and electrode wear. Curve B is preferred
since it shows more tolerance to changes in weld energy and has nearly the same bond strength as Curve C.
A comparison of weld schedules for several different applications might show that they could be
consolidated into one or two weld schedules. This would have obvious manufacturing advantages.
Destructive Testing
Destructive Testing can be performed on the actual work piece or on test specimens. For small, inexpensive
parts, actual production samples, taken on a random basis, should be used. Destructive tests made on spot
welds include tension, tension-shear, peel, impact, twist, hardness, and macro-etch tests. Fatigue tests and
radiography have also been used. Of these methods torsional shear is preferred for round wire and a 45
degree peel test for sheet stock.
14
12
10
8
6
4
2
20
30
40
50
60
70
80
90 100
A = 8 lbs
B = 10 lbs
C = 12 lbs
D = 14 lbs
Energy (watt seconds)
Electrode Force
A
B
C
D
MOLY
.032 DIA TINNED
COPPER WIRE
0.010 X 0.030 Ni RIBBON
RWMA 2
Figure 5-2. Typical Weld Strength Profile


