FLIPR
®
Tetra High Throughput Cellular Screening System User Guide
0112-0109 H
79
Analysis Process
The
Analysis
process is included in all protocols, and is always the
second process after
Settings
.
In the sections below:
•
Data viewing options on the
Analysis
process page are covered
in
•
Grouping
and
Correction
are explained in
•
Auto-Export
is covered in
.
Viewing Data
Acquired data can be viewed in ScreenWorks Software on the main
Analysis
process page, in the
Multi-Well Graph
, or in larger
Detail
Graph
. The options are described in this section.
Multi-Well Graph
The major part of the
Analysis
process page consists of a grid
representing the wells of the read plate used in the protocol or data file
(for example
,
with 96, 384, or 1536 wells). This is called the
Multi-Well Graph
. For protocol files this graph is empty, as no data
have been acquired, but in data files each cell of the graph has a trace
of one of the measurements taken from the corresponding read plate
well. The maximum and minimum RLU values of the displayed data are
reported above the Multi-Well Graph.
The Multi-Well Graph displays, for each well represented, one trace of
relative light units (RLUs) versus time. If two or more read modes were
recorded, select the mode to view from the display list box above the
graph. To see the ratio of two read modes, enable
Ratiometric
Options
in the
Configure Corrections > Corrections
dialog, and
select
Ratio
in the display list.
The
Read Mode
defined in the Multi-Well Graph is also applied to any
traces displayed in the
Detail Graph
.
The traces displayed in the Multi-Well Graph can be adjusted by the
application of different data-correction options available in the
Correction
dialog, for example
,
the traces can be scaled relative to the
average positive control response (see
).
If groups have been defined for the assay, wells in the Multi-Well Graph
are color-coded to represent these (see
addition, there is the option to include the kinetic reduction value below
each well trace in the Multi-Well Graph.
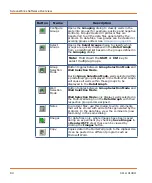
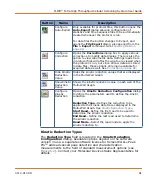
Buttons, just above the Multi-Well Graph, open dialogs that offer
various data analysis options; some relevant to protocol set up, some
to already-acquired data in data files, and some to both. Multi-Well
Graph buttons and descriptions include:
Summary of Contents for FLIPR Tetra
Page 1: ...FLIPR Tetra High Throughput Cellular Screening System User Guide 0112 0109 H December 2011...
Page 12: ...Contents 12 0112 0109 H...
Page 16: ...System Overview 16 0112 0109 H...
Page 40: ...System Hardware Features 40 0112 0109 H...
Page 148: ...Exchanging Hardware 148 0112 0109 H...
Page 156: ...Calibration and Signal Test 156 0112 0109 H...
Page 196: ...Running an Experiment 196 0112 0109 H...
Page 232: ...Robotic Integration 232 0112 0109 H The following drawings illustrate these requirements...
Page 282: ...Data Processing Algorithms 282 0112 0109 H...
Page 294: ...Consumables and Accessories 294 0112 0109 H...
Page 298: ...Using AquaMax Sterilant 298 0112 0109 H...
Page 302: ...Electromagnetic Compatibility EMC 302 0112 0109 H...


