PC EVALUATION SOFTWARE ENCUR
EnDaL curve/vi
- 32 -
5 . 7 . 3 . 4
C l a s s i f i c a t i o n
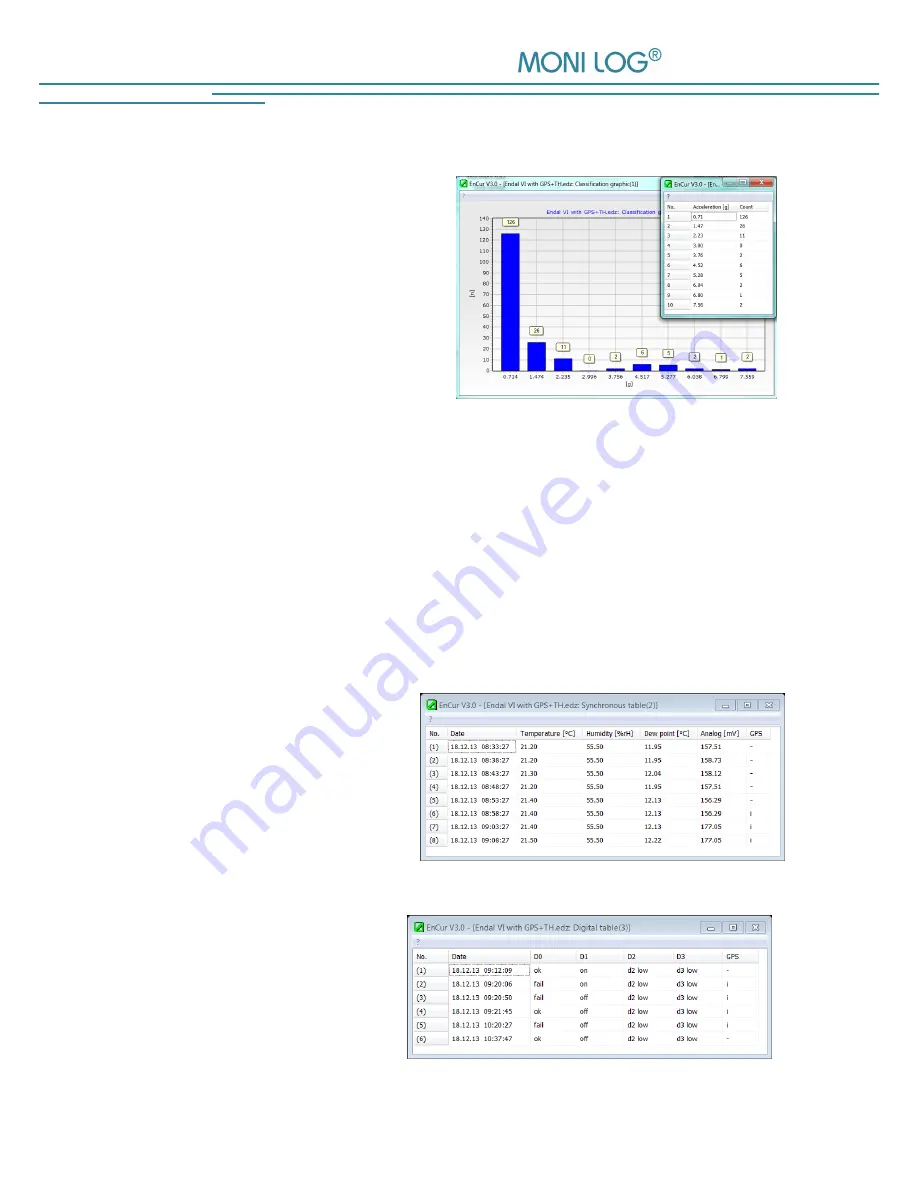
The classification orders the occurred shocks of an
acquisition period into 10 classes. The classification
is carried out according to the maximum value. The
classification is on a linear basis. Under “
Options
Classification
”, parameters for the classification
(magnitude, velocity, shock duration) can be
selected.
The classification can be displayed in tabular form
or in form of a bar graph.
In both windows, it is possible to open a popup
menu by a right click. There, you can toggle
between tabular or bar graph form and print or export the distribution.
5 . 7 . 3 . 5
L i m i t T a b l e
The limit table filters shock events in the acceleration table regarding the configured threshold for the
selected acquisition period. Under “Options
Limit value”
,
the parameter and threshold can be set. The
meaning and functionality of the limit table is equal to that of the acceleration table (see 5.7.3.1). The total
number of all measured values exceeding the threshold is represented by the field “
Limit value
” of the status
data.
5 . 7 . 4
C o n t i n u o u s l y m e a s u r e d d a t a ( S y n c h r o n o u s d a t a )
The cyclically measured data are represented
by the synchronous table. Depending on the
device configuration and active sensors
,
the
table indicates, including timestamps, the
measured temperature and relative humidity,
the calculated dew point, the analogue
measuring channel as well as the availability
of GPS coordinates
(“i”
). Using the context
menu
,
GPS data can be viewed with the
external program and the table can be printed or exported.
5 . 7 . 5
D i g i t a l E v e n t s
Each time a digital channel senses a change
of its logic state (high or low), a digital event
will be generated. There are 4 digital
channels in total. The logic states will be


