23
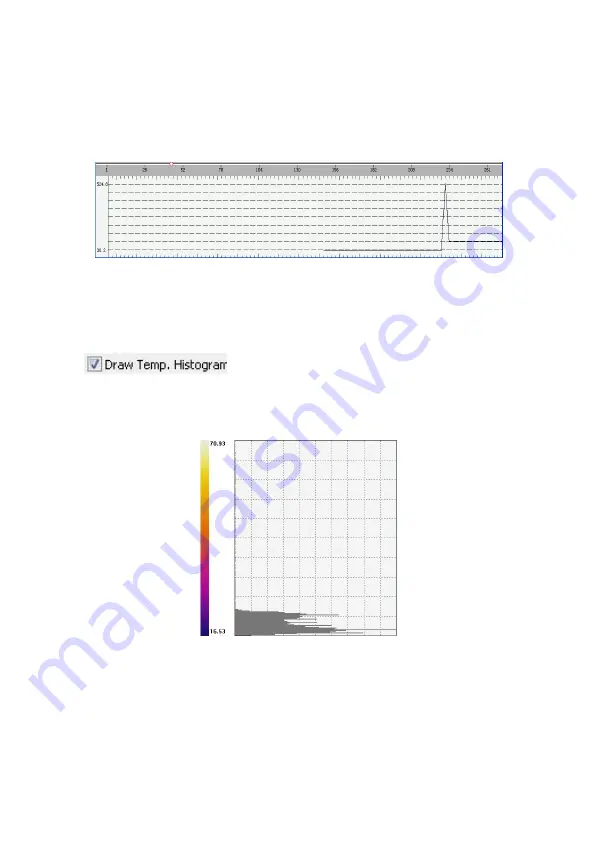
Analyze the trend range of highest temperature when
users play the videos. And it will analyze all frames. As shown
in the figure 5-24.
Figure 5-24
5.6 Histogram
In
the
right
menu
bar,
there
is
an
option
“
”. Please check it. Then it will analyze the
temperature distribution of each frame when users play the
videos. As shown in the figure 5-25
Figure 5-25
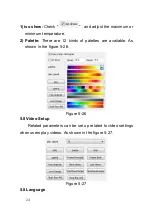
5.7 Iso show & Palette
Summary of Contents for IR-CAM-160-P4
Page 11: ...7 3 4 Core Structure Figure 3 4 384 288...
Page 12: ...8 Figure 3 4 640x480...


