Applicable to: B22 and B25 (a ll versions)
Revision 1.3 – 02/24/ 2015
Manual B – Operations
-
43
B25 Version
Cons umption[l/h]
@rpm/
MAP [inHg]
B
25D
B
25H*
B
25L
B
25R
Take off
27.6@3400/
29.9
35.4@4300/
29.9
34.5@4200/
29.9
38.5@4700/
29.9
Max continuous
23@3330/
27.7
29.6@4300/
27.8
28@4070/27.7
30.3@4500/
27.7
At 75% max cont.
17.8@3030/
25.7
22.8@4300/
24.6
20.9@3700/
25.6
23.5@4090/
25.5
At 65% max cont.
16.2@2880/
25.3
---
18.7@3530/
24.6
20.6@3900/
24.5
At 55% max cont.
14.7@2730/
24.8
---
15.9@3330/
23.4
17.4@3690/
23.4
B.5.6.2.C
* Data refers to the engine model without reduction gear box
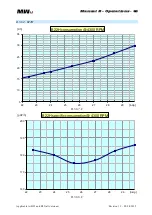
The fuel consumption indicated in the table refers to an engine working with a fixed pitch
propeller, so that the engine power output is unequivocally related to the propeller speed. In the
case of a variable pitch propeller, it is possible to calculate the fuel consumption using the
following graph. As a general consideration, with the same power output, the consumption is
lower at higher RPM and lower throttle position.
The following paragraph indicates the fuel consumption of each engine model:
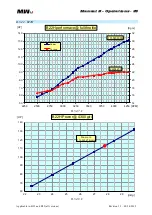
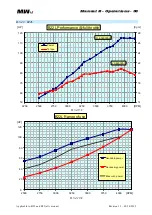
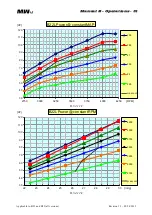
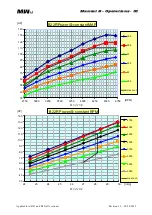
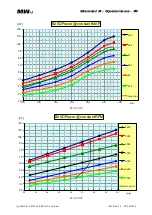
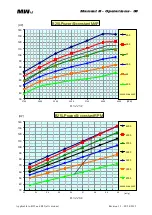
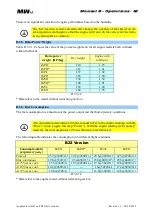
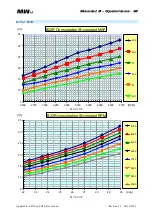
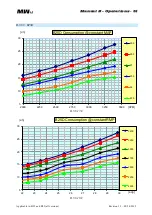
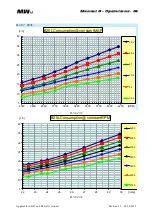
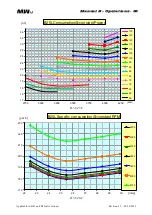
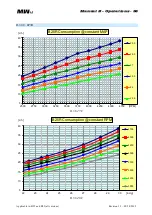
Graph CONSUMPTION PER H/RPM with constant MAP: each curve refers to a value of
MAP (indicated in inches of mercury inHg), and it is the fuel consumption in liters per hour,
in function of the RPM.
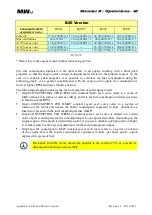
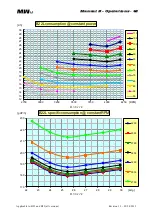
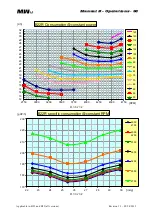
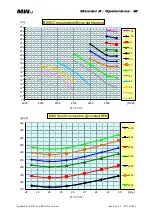
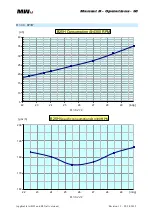
Graph CONSUMPTION PER H/MAP constant speed: each curve refers to a regime of
rotation of the motor and returns the hourly consumption expressed in liters, obtained as a
function of pressure in the inlet manifold pressure (MAP).
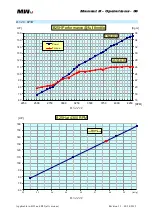
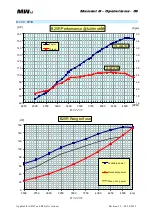
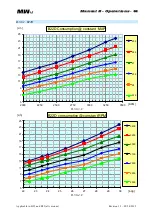
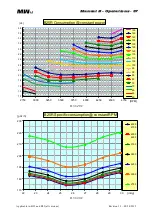
Graph CONSUMPTION PER H/RPM at constant power: each curve is related to a certain
value of power and represents the consumption per hour, expressed in liters, depending on the
engine regime. This graph is particularly useful, if you use a variable pitch propeller in flight,
to evaluate which is the best consumption with the same horsepower output.
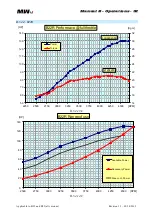
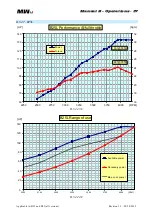
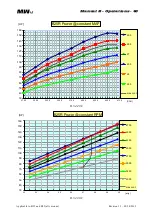
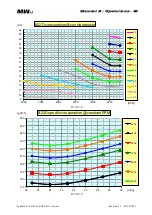
Graph specific consumption / MAP constant speed: each curve refers to a regime of rotation
of the engine and is the hourly consumption, expressed in liters, per horse power output,
expressed in grams of fuel.
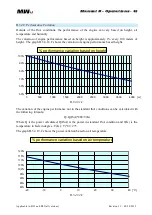
Deviations from the curves shown are possible to the extent of 5%, as a result of
dimensional tolerances and assembly
.

