NATIVE-C1
T
ECHNICAL
R
EFERENCE
M
ANUAL
V1.0
C
HASSIS
D
ESIGN
- 35 -
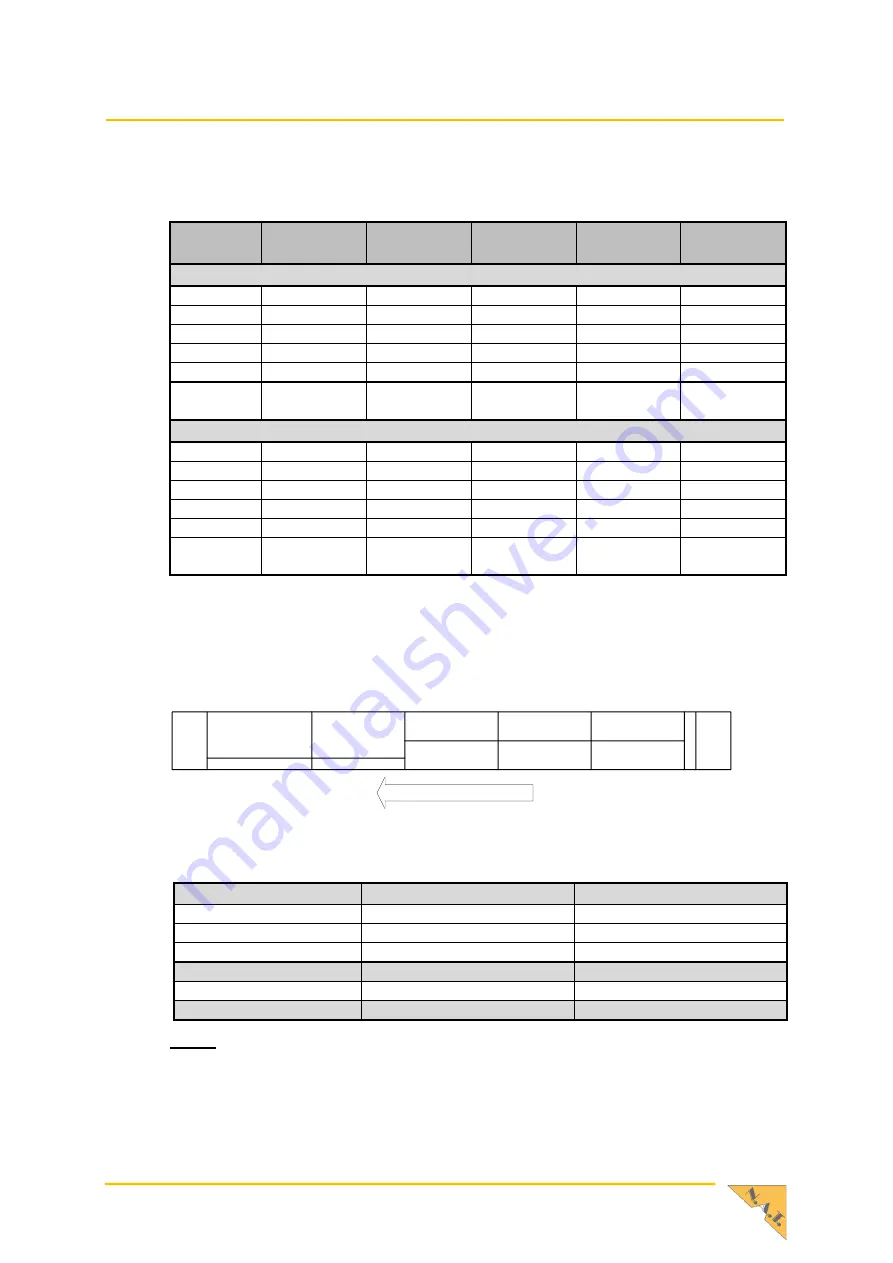
Table 18
–
Airflow Uniformity for each Bay and the AMC Zones
Slot
Column 1
Slot
Column 2
Slot
Column 3
Slot
Column 4
Slot
Column 5
Upper Mid-Size Bay
I/O Zone
3.79
4.48
4.54
4.60
5.21
Zone A
8.43
10.84
10.72
10.68
10.28
Zone B
10.65
12.29
11.91
11.63
10.74
Zone C
11.67
12.38
11.92
11.58
10.77
Zone D
9.25
9.61
9.42
9.42
9.24
Backplane
Zone
0.89
1.57
2.68
3.00
3.13
Lower Mid-Size Bay
I/O Zone
6.11
5.97
5.89
5.08
5.79
Zone A
10.24
8.33
8.70
9.23
10.19
Zone B
13.31
11.37
11.16
11.11
10.79
Zone C
13.20
11.52
11.05
11.07
10.83
Zone D
9.22
7.97
8.44
9.12
9.54
Backplane
Zone
3.24
3.43
3.56
3.47
3.49
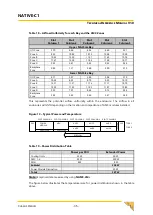
This represents the potential airflow uniformity within the enclosure. The airflow in all
enclosures will shift depending on the location and impedance of AMC modules installed.
Figure 13
–
Typical Power and Temperature
CU1
CU2
POWER
MODULE
MCH
2HP FILLER
2HP FILLER
AMC1
AMC2
AMC3
AMC4
AMC5
AMC6
FI
LT
E
R
SLOT COLUMN 1
SLOT COLUMN 2 SLOT COLUMN 3 SLOT COLUMN 4
SLOT COLUMN 5
TIER 1
TIER 2
AIRFLOW
Table 19
–
Power Distribution Table
Power per FRU
Extended Power
Cooling Units
25 W
50 W
AMC 1-6
50 W
300 W
MCH
8 W
8 W
Subtotal
358 W
Power Module Dissipation
29 W
Totals
387 W
Note:
Empirical data measured by using
NAMC-LM
s.
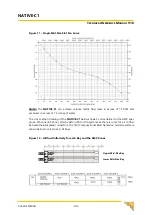
The figure below illustrates the temperature raise for power distribution shown in the table
above.

