Section 8- Protein A280
Spectrum Overlay Control
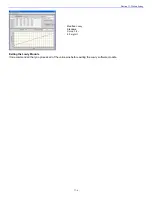
The user can display more than one spectrum in the same display using this feature. The current sample plot will be
displayed in bold and previous plots will be distinguished by different colors as seen in the following example:
The default option is set to clear the display for the next reading. The user may set the overlay control to clear after each
sample plot (default setting), after each new report, or accumulate plots until prompted to clear. The ‘Clear Now’ setting
will clear all current and previous plots. When the overlay function is active, the software module will auto scale the y-axis
based on the sample with the highest absorbance at 280nm. Note: When the overlay function is active, the ‘Blank’ function
doesn’t clear the existing overlaid sample spectra
.
8-3


