38
à
go back to contents
à
go back to contents
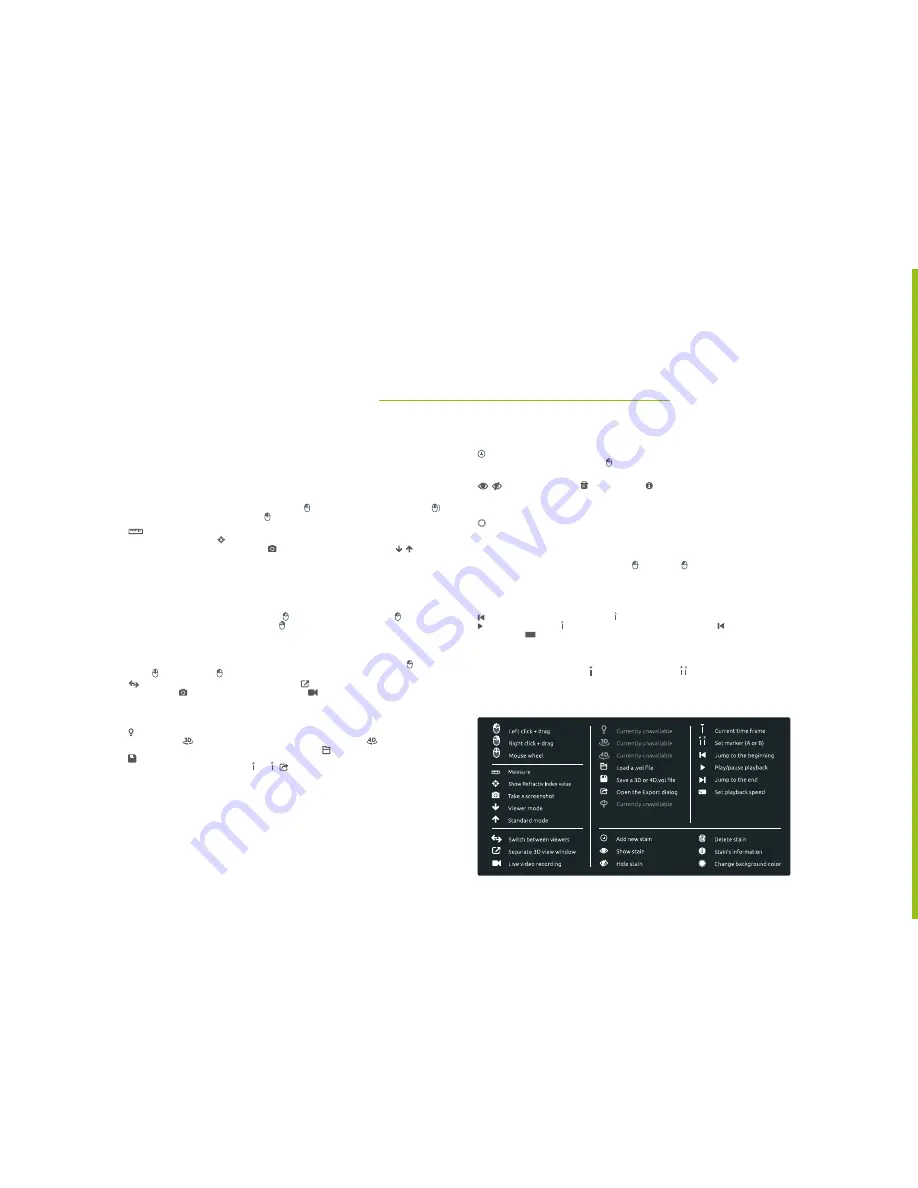
Explanation of icons
Please also refer to our video on our homepage
“Introduction and getting started video for STEVE”
.
10. Software STEVE
Getting started with
STEVE
STEVE
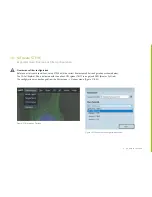
is Nanolive’s software for exploring the data acquired using the 3D Cell Explorer. For
each recorded frame, the 3D Cell Explorer measures the Refractive Index of your cell in three
dimensions. Use
STEVE
to digitally stain your data and interactively explore your cell and its
subcomponents
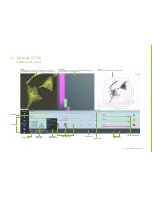
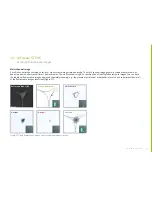
2D VIEW
The 2D view shows an X-Y slice of the sample’s Refractive Index overlaid with the user-defined
stains. In this view you can: Move to a different slice ( or via Slices slider) • Zoom in or out (
Move the view when zoomed in (SHIFT + ).
: Measure (or stop measuring) a user-defined path length. Click this button and click on
the image to draw a path • : Show the Refractive Index and the Index Gradient in the Panel
Viewer of a selected voxel in the 2DView • : Take a screenshot of the 2D view • / : Switch
between Standard mode and Viewer mode.
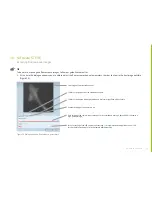
PANEL VIEWER
The panel viewer represents a 2D space of Refractive Index (horizontal axis) and Index Gradient
(vertical axis). Stains are shown as rectangles covering a region in the staining space. Regions
on the right have a high Refractive Index, regions on the top have a high Index Gradient.
In this view you can: Change a stain’s position ( on the stain’s center) or shape ( on the
stain’s edge) • Change a stain’s transparency ( on the stain’s center/edge or via the Opacity
and Edge Softness sliders).
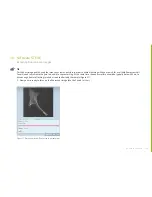
3D VIEW
The 3D view shows the stained data in three dimensions. In this view you can rotate ( ) •
Zoom ( ) • Move (SHIFT + ) the 3D data.
: Switch between Voxel View and Surface View • : Detach the 3D view from
STEVE’s
main window • : Take a screenshot of the 3D view • : Start or stop a live video recording
of the 3D view.
BUTTONS AREA
: Visualize your sample in white light. Move the microscope’s knobs to search and focus your
cell of interest • : Single shot acquisition: acquire a single 3D frame • : Time-lapse
acquisition: acquire multiple 3D frames in a range of time • : Load a measurement file (.vol) •
: Save a 3D or 4D measurement file (.vol). To save a 4D file, please indicate the desired
range on the time line using markers and • : Open the Export dialog.
SLIDERS AREA
Overlay: Fuzzy switch between stained data and unaltered Refractive Index.
Slices: Selects the X-Y slice from the 3D data stack.
Opacity: Chooses the opacity for the currently selected stain.
Edge Softness: Use this to make a stain’s edges soft and avoid solarized images in 2D.
STAIN COLORING AREA (PANEL)
Load Panel: Load a previously saved panel (.xml format)
Save Panel: Save the current panel (stains)
Rescale: Modify the viewing range of the panel viewer to fit the current time frame.
STAIN PICKER
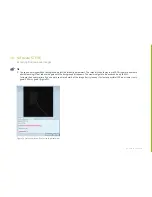
: New stain - choose a name (not required) and a color for the stain. Next, begin painting
your region of interest in the 2D view ( ). A rectangular stain is computed based on the
painted part of the image and is shown in the panel viewer.
/ : Hide or show a stain • : Delete a stain • : Show the stain properties and allow
background definition.
3D CONTROL AREA
: Change the background color for the 3D view.
Hide Axes & Cube: Show/hide the coordinate axes and the outline cube in the 3D view.
Show Caption: Show/hide the labels in the 3D view.
Cropping sphere: Cut away part of the 3D view. Move the plane through the sphere to crop
the 3D data. The plane can be moved (SHIFT + ) or rotated ( ).
TRANSPORT CONTROL
Use this to explore your data in time. The transport display shows the frame number and
acquisition time of the current frame.
: Jump to the beginning of a data set • : Set marker A to the current cursor position •
: Play/pause playback • : Set marker B to the current cursor position • : Jump to the end
of a data set • : Set playback speed. (Note: Markers A and B select a time range for saving/
exporting purposes.)
TIME LINE AREA
Displays the current time frame ( ) and the selected range ( ).
Click on the top part of the area to jump to the specified frame. Drag on the tick region to set
markers A and B.
August 2015
1x
Getting started with Nanolive’s software STEVE v1.0

