


Page 20
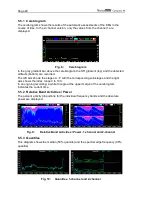
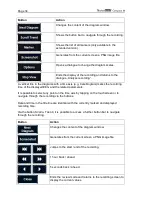
5.5.1 Cerebrogram
The cerebrogram shows the results of the automatic assessments of the EEG in the
course of time. In the 2-channel version, only the values from the channel 1 are
displayed.
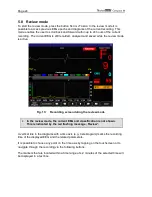
Fig. 8:
Cerebrogram
In the gray gradient bar above the cerebrogram, the STI gradient (top) and the detected
artifacts (bottom) are recorded.
The left axis shows the stages A - F with the corresponding sub-stages and the right
axis shows the index range 0 to 100.
In an ongoing recording, a white triangle at the upper margin of the cerebrogram
indicates the current time.
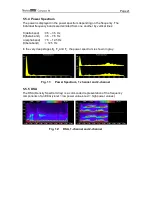
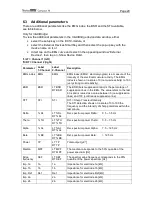
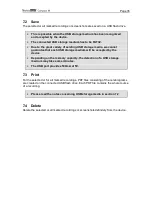
5.5.2 Relative Band Activities / Power
The percent activity proportions for the individual frequency bands and the absolute
power are displayed.
Fig. 9:
Relative Band Activities / Power, 1-channel and 2-channel
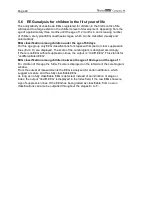
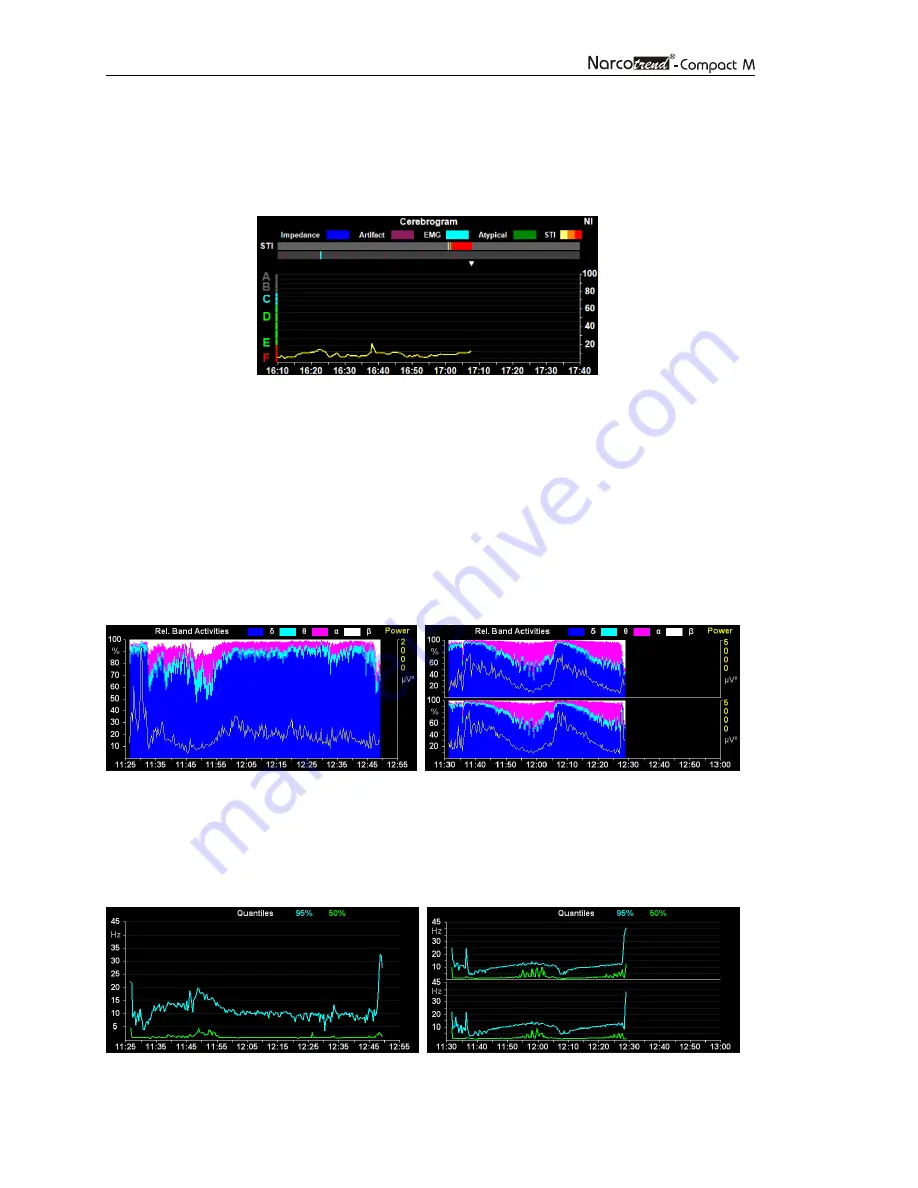
5.5.3 Quantiles
This diagram shows the median (50% quantile) and the spectral edge frequency (95%
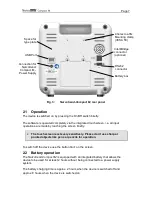
quantile).
Fig. 10:
Quantiles, 1-channel and 2-channel