


Page 21
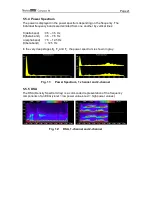
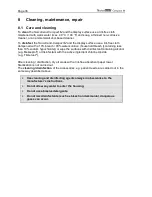
5.5.4 Power Spectrum
The power is displayed in the power spectrum depending on the frequency. The
individual frequency bands are delimited from one another by vertical lines:
δ
(delta band)
: 0.5 – 3.5 Hz
θ
(theta band)
: 3.5 – 7.5 Hz
α
(alpha band)
: 7.5 – 12.5 Hz
β
(beta band)
: > 12.5 Hz
In the very deep stages E
2
, F
0
and F
1
, the power spectrum is shown in gray.
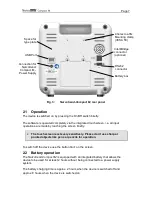
Fig. 11:
Power Spectrum, 1-channel and 2-channel
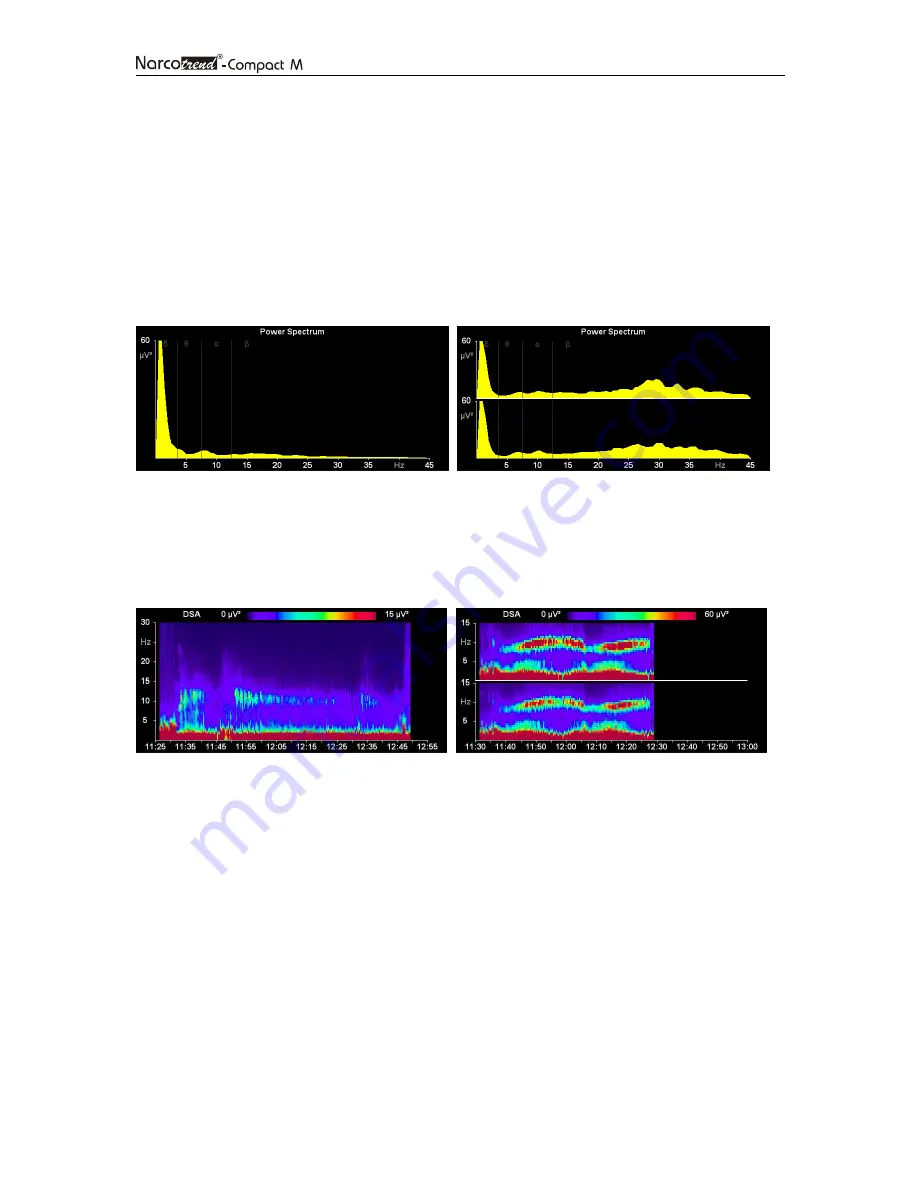
5.5.5 DSA
The DSA (Density Spectral Array) is a color-coded representation of the frequency
components of an EEG (violet = low power values, red = high power values).
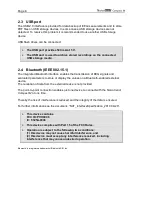
Fig. 12:
DSA, 1-channel and 2-channel