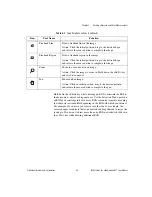
Chapter 3
Making Grayscale and Color Measurements
©
National Instruments Corporation
3-5
IMAQ Vision for LabWindows/CVI User Manual
3.
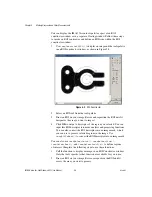
Click
OK
to populate a structure representing the ROI. You can use
this structure as an input to a variety of functions, such as the following
functions that measure grayscale intensity.
•
imaqLightMeterPoint()
—Uses the output of
imaqSelectPoint()
•
imaqLightMeterLine()
—Uses the output of
imaqSelectLine()
•
imaqLightMeterRect()
—Uses the output of
imaqSelectRect()
Tools Palette Transformation
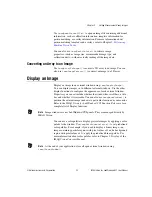
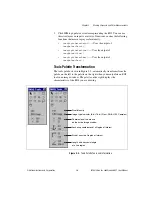
The tools palette, shown in Figure 3-3, automatically transforms from the
palette on the left to the palette on the right when you manipulate an ROI
tool in an image window. The palette on the right displays the
characteristics of the ROI you are drawing.
Figure 3-3.
Tools Palette Tools and Information
Image-type indicator (8-bit, 16-bit, Float, RGB, HSL, Complex)
Coordinates of the mouse
on the active image window
Anchoring coordinates of a Region of Interest
Size of an active Region of Interest
Length and horizontal angle
of a line region
Pixel Intensity

