Chapter 2
Order Analysis
LabVIEW Order Analysis Toolset User Manual
2-2
ni.com
vibration signals. The frequency-domain representations of noise and
vibration behave as harmonics of the machine rotational speed.
In many industries, the harmonics related to the rotational speed are
referred to as orders. The corresponding harmonic analysis is called order
analysis. The harmonic at the same frequency as that of the rotational speed
is the first
order; the harmonic at twice the frequency of the rotational speed
is the second order and so on. Therefore, you can think of order analysis as
an application of harmonic analysis for rotating machinery.
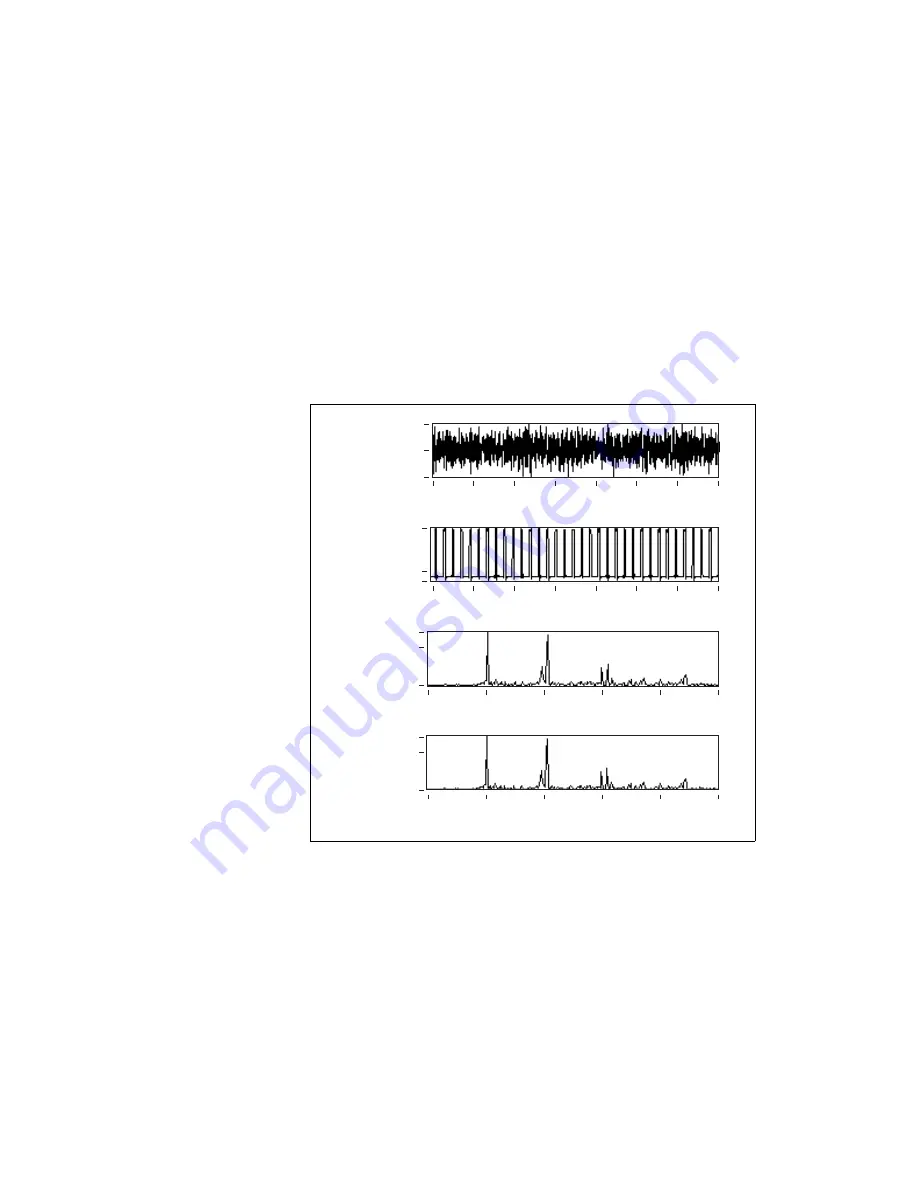
Figure 2-1 shows the relationship between frequency and order spectra.
Figure 2-1.
Order and Frequency Domain Display of a Shaft Rotating at 3,000 rpm
The top graph in Figure 2-1 shows a vibration signal from a machine
running at 3,000 revolutions per minute (rpm). The rotational speed is
computed from the tachometer signal, which is shown as the second graph
in Figure 2-1. The frequency domain and order domain plots of the signal
are shown in the third and fourth graphs, respectively, in Figure 2-1.
Vibr
ation
T
achometer
F
requency
Spectr
um
Order
Spectr
um
Time (s)
Time (s)
Frequency (Hz)
Order
0.0
0.1
0.2
0.3
0.4
0.5
0.6
0.7
0.0
0.1
0.2
0.3
0.4
0.5
0.6
0.7
1.7E+4
0.0E+0
–1.9E+4
1.1E+3
–2.5E+4
3.0E+6
2.0E+6
3.3E–2
3.0E+6
2.0E+6
3.3E–2
0.0
100.0
200.0
300.0
400.0
500.0
0.0
2.0
4.0
6.0
8.0
10.0


