Chapter 3
Gabor Transform-Based Order Tracking
©
National Instruments Corporation
3-7
LabVIEW Order Analysis Toolset User Manual
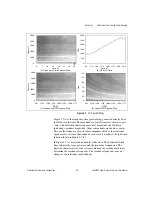
Figure 3-4(b) shows a mask array around the fourth order with a constant
frequency bandwidth. The TRUE values comprise the white area, while the
FALSE values comprise the black areas.
Figure 3-4(c) shows the masked coefficients. The black areas indicate
values set to zero and correspond to the FALSE values in the mask array.
The white area contains values copied from the original coefficient array
and corresponds to the TRUE values in the mask array.
Figure 3-4(d) shows the frequency-time spectral map of the reconstructed
signal.
Reconstructing the Signal
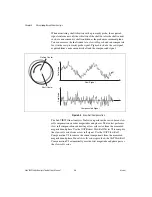
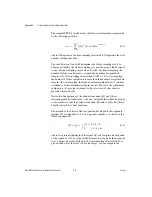
Figure 3-5 shows the fourth-order time waveform that was reconstructed
by performing a Gabor expansion on the masked coefficients from
Figure 3-4.
Figure 3-5.
Original Signal and Extracted Order Component
Unlike the reverse discrete Fourier transform, the Gabor expansion, in
general, is not a one-to-one mapping. A Gabor coefficient is the subspace
of a two-dimensional function. An arbitrary two-dimensional function,
such as the masked coefficient array, might not have a corresponding time
waveform. Usually, the Gabor coefficients of the reconstructed time
waveform are not exactly the same as the desired coefficients you mask.
However, in terms of the least mean square error (LMSE), the Gabor
coefficients of the reconstructed time waveform are the coefficients closest
to the desired coefficients you mask.
Like conventional time-invariant filters, the time-variant filters
implemented by the Gabor expansion have a certain passband and
attenuation. The extracted time waveform is only a part of the original
signal whose frequencies fall into the passband determined by the Gabor
1.0–
0.5–
0.0–
–0.5–
–1.0–
10.0
12.0
4.0
0.0
2.0
6.0
8.0
14.6
Time (s)
Original Signal
Extracted 4th Order
Vibr
ation (m/s
2
)


