ZephIR user manual QP1009-582 v2
© Natural Power 2008
10
th
June 2008
Page 31
Wind Data Playback
The PC software has the ability to play back wind data
recorded by the ZephIR. See the document on data
download for information on retrieving this data.
Wind data comes in two types; wind data and Spectra.
Wind data contains the processed data from the
ZephIR. This consists of speed, direction and turbulence
information, calculated every 3 seconds.
Spectra is the partially processed data that the ZephIR
uses to calculate the wind speed.
In most operations only the wind speed will be of interest.
1.
Wind Data Playback
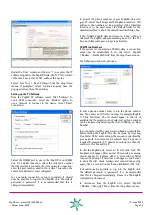
Wind data files have the .wnd extension. To open one, run
the ZephIR software and select ‘File’ >’Open Wind Data
File’ from the drop down menus.
This will open a standard windows dialogue box to allow
you to select a wind data file.
Once a file has been opened, the status bar at the bottom
should read ‘working from file’ and the display controls
should become active (turn from grey to blue):
Set the speed to the desired value. A value of 1 will play
back the data in real time. A value of 0.1 will play it back
at 10 times speed and a value of 10 will play it back at
1/10th speed.
Click on the play (triangular) control to begin playback.
The pause (double lines) control will stop playback and
allow it to continue from the same place by clicking play.
The stop (square) control will stop playback and reset the
reference to zero so that playback will next resume from
the start of the file.
Playback is indexed by reference number. To start at a
particular reference, stop playback and enter the reference
into the ‘Reference’ box in the information frame. Click
play.
Playback will begin at the first entry with a reference
greater than or equal to that entered.
Since the ZephIR will wrap around its wind data file if it
gets full, it is possible for the data to not be in correct
reference order. To correct for this select ‘File’ >’Save
Wind Data’. Select a new filename for the re-ordered file
and click OK. The data will be saved to the new file in
reference order. Open the new file to use the corrected
data.
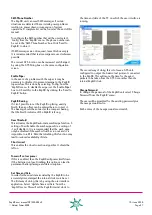
As well as the data displayed in the information bar, the PC
software also provides a graphical output of the wind data.
The ‘figure of eight’ output will display a line showing the
compass direction of the current wind reading (top being
North).
The history display shows how the wind changes with
height and time. Each wind height is drawn in a different
colour, from left to right as time progresses.
If ‘Stop on Status Flags’ is selected, then data playback
will automatically halt if a problem (or potential problem) is
displayed in the status flags.


