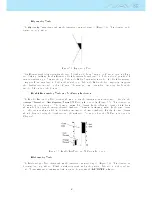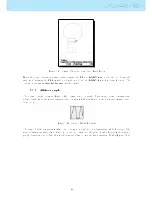
During a competition task ight using the optimal tangent navigation saves a substantial amount of time.
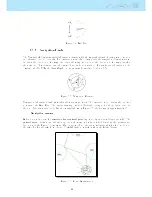
The smaller arrow 2 in the Figure
3.6
example points to the centre of next waypoint cylinder (WP1), and
the arrow 3 points to the optimised edge of the waypoint after the next one (WP2). The combination of
all three arrows provides a spatial location of the pilot relative to the next 2 waypoints. The example in
Figure
3.6
shows a hypothetical task. A pilot navigating to the centre of the waypoint (following arrow
2) will probably be ying the blue course, whilst a pilot navigating using arrow 1, so probably ying the
optimised route (red course), will y the substantially shorter route. The direction to the waypoint after
the next one (WP2) is represented by arrow 3. In the example arrow 3 is pointing along the green line,
which shows the direction to WP2, even though WP1 has not been reached. Small course corrections are
sometimes required and these are shown on the NAV SD by a ne adjustment indicator in the form of the
small arrow 4. Arrow 4 to the left means the pilot should turn slightly to the left, and inversely arrow 4
to the right indicates a small adjustment to the right is needed. In the example of Figure
3.6
arrow 4 is
pointing to right indicating that the pilot should turn right slightly.
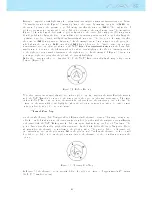
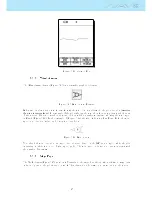
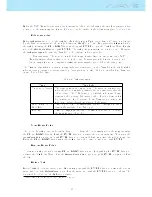
When the course is perfect, i.e. less than 1º o, the NAV SD indicates this by showing a large arrow
forward (Figure
3.7
).
Figure 3.7: Perfect Heading
Note that, a start is automatically validated when a pilot correctly completes the start. Until the start is
valid the NAV SD will not advance to the next point in the route. Another important aspect of the start
is that the NAV SD does not point to the start cylinder but rather to the next turn point on the list. The
distance to the start will become highlighted when the pilot is in an irregular position, i.e. inside a start
cylinder where he should be out or vice-versa.
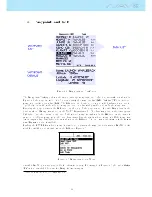
Thermal Core Map
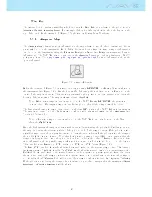
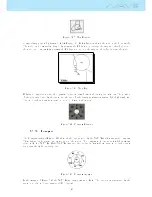
Another useful feature of the Navigation Circle Element is the thermal core map. This map corresponds to
a black dot which is shown inside the inner navigation wheel (together with the navigation arrows).During
a thermal climb the NAV SD keeps track of the strongest climb values point for each 50m layer. The
point of strongest lift is then graphically represented by the black ball in the inner Navigation Circle,
showing where the thermal core is relative to the pilot's position. The position of the dot (thermal core)
is constantly updated as the pilot moves. When the pilot is over 300m from the thermal core the dot will
be at the edge of the circle. As the pilot moves closer to the thermal core the dot will move towards the
center.
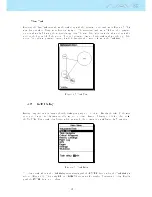
Figure 3.8: Thermap Core Map
In Figure
3.8
the thermal core is currently behind the pilot at a distance of approximately 150 meters
(half of 300 m wheel radius).
12
Summary of Contents for Flymaster NAV SD
Page 1: ...User manual Version 3 0...
Page 54: ...Figure 4 42 GPS Reset 53...

