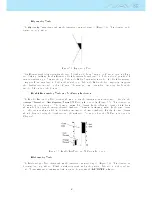
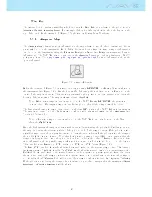
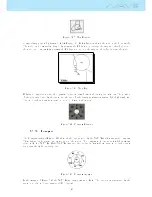


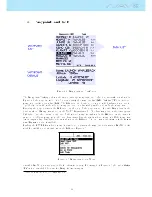


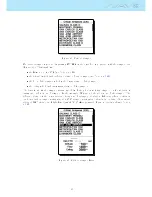

Figure 3.10: Airspace Map and Associated Data Fields
When the page contains an airspace map element, the UP, and DOWN keys, can be used to change the
map scale: pressing the UP key will decrease the scale, and the DOWN key will increase the scale. The
corresponding user dened key function will be disabled.
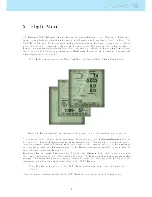
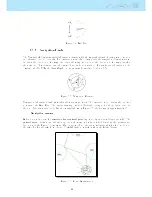
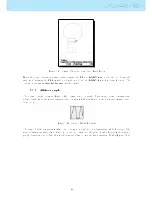
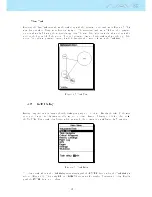
3.1.7 Altitude graph
The Altitude graph element (Figure
3.11
) corresponds to a graph of barometric altitude versus time.
Altitude is shown in the vertical axis graduated in meters with time shown on the horizontal axis graduated
in seconds.
Figure 3.11: Altitude Graph Element
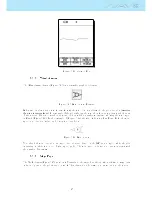
The range of the horizontal axis is xed and corresponds to 240 seconds (4 minutes), while the range of the
vertical axis is automatically adjusted in order to accommodate the gained height. In reality the altitude
graph element is a plot of the absolute barometric altitude over the last 4 minutes of ight (Figure
3.12
).
14
Summary of Contents for Flymaster NAV SD
Page 1: ...User manual Version 3 0...
Page 54: ...Figure 4 42 GPS Reset 53...