4-6
Monitoring the ft Server
CPU Modules
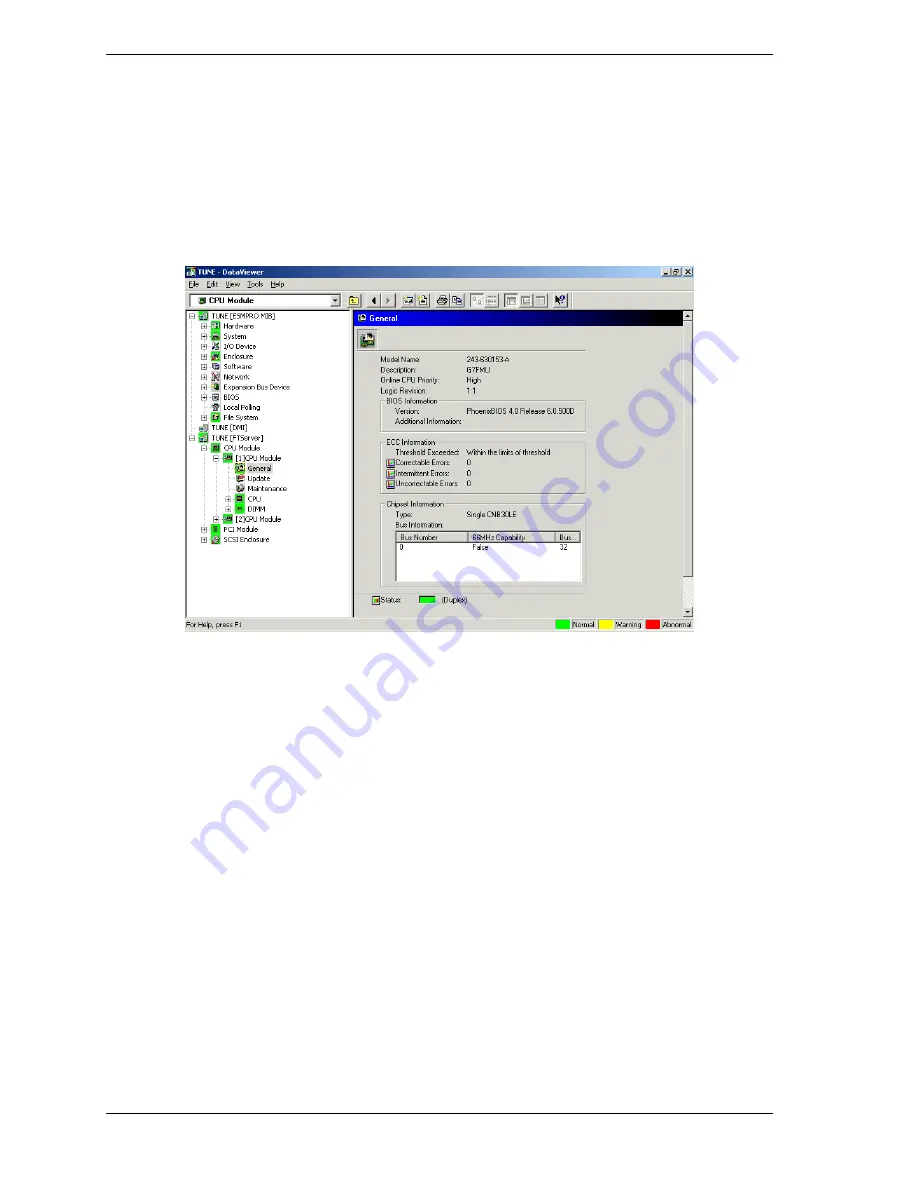
Your ft server includes two CPU modules that you may monitor using the Data
Viewer. When you select a CPU module, five folder icons display: General,
Maintenance, Update, CPU, and DIMM.
General
Selecting the
General
folder Data Viewer displays the CPU module
General
screen.
The
General
screen displays information about the CPU module selected. This
screen displays information pertaining to the selected CPU module’s
description, system BIOS information, ECC information (memory errors),
chipset information and CPU module status.
ECC Information:
ESMPRO monitors and logs correctable, intermittent, and
uncorrectable DIMM errors within predetermined thresholds you set. The totals
of these errors are displayed in the DIMM screen. DIMM errors over a period of
time may be viewed in graph form by selecting the graph icon next to the
reported error.
Status
The color of this display indicates the current status of the CPU module as
compared to set threshold values of components in the CPU module.
Green
: Selected CPU module is up. (
Duplex)
indicates companion CPU
module is also up. All values are within threshold limits.
Yellow
: Some values have reached the Warning or Minor alert limit.
(Simplex)
indicates the companion CPU module is down.
Red
: Some values have reached the Fatal or Major alert limit.
Gray
: Selected CPU module is down.


