334
Device Information Confirmation
|
■
Chart
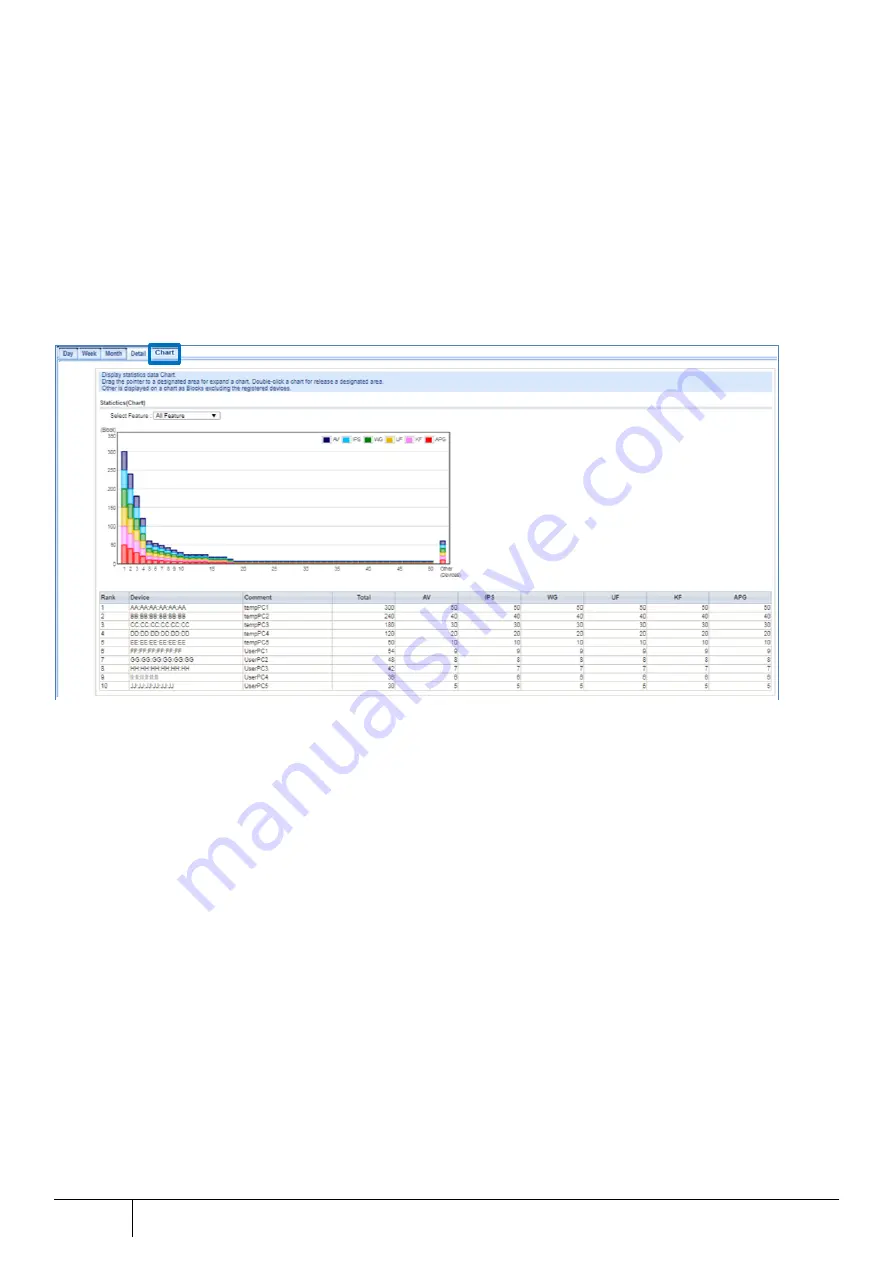
On the graph screen, the number of blocks per terminal is displayed as a graph. For the terminal to be displayed, set it
in Section 5.9.3 Device Manager. From the left side, it is displayed in descending order of the number of blocks. This
makes it easier to understand the trend such as whether or not blocks are biased to a specific terminal. The number
of blocks starts to be collected from the day the target terminal is set as target for statistical information collection for
each terminal and will be displayed as a total value for up to 90 days.
[For enlarged view]
When it is difficult to see the graph, use the enlarged display by specifying the range by dragging. Double-clicking on
the graph will cancel the magnified display.
1.
Open the [Statistics] screen from [TOP]-[Security].
2.
Click the [Graph] tab and check the occurrence status of the blocks from the block graph.
3.
Click [Select Function] to display the security/scan function.
The "*" mark in the column of the table indicates the selected security/scan function.
[Note]
"Other" on the right side of the graph shows the total number of blocks of terminals that are not set for statistical
information collection for each terminal.
Use enlarged display if graph is difficult to see due to bias in the number of blocks, etc.
[Note]
If the graph screen is not displayed properly, confirm the following points.
Internet Explorer is used, update to version 11 or later
Change the following Internet Explorer settings
Uncheck "Tools" -> "Compatibility View Settings" -> "Display intranet sites in Compatibility View"
*Changing the "Display intranet sites in Compatibility View" may affect normal browsing.
In this case, use the "Display intranet sites in Compatibility View" setting.


