Technical Discussion
110
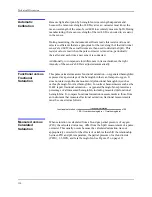
Automatic
Calibration
Because light absorption by hemoglobin is wavelength dependent and
because the mean wavelength of LEDs varies, an oximeter must know the
mean wavelength of the sensor's red LED to accurately measure SpO
2
. During
manufacturing, the mean wavelength of the red LED is encoded in a resistor
in the sensor.
During monitoring, the instrument's software reads this resistor value and
selects coefficients that are appropriate for the wavelength of that individual
sensor's red LED; these coefficients are then used to determine SpO
2
. This
resistor value is read when the pulse oximeter is turned on, periodically
thereafter, and each time a new sensor is connected.
Additionally, to compensate for differences in tissue thickness, the light
intensity of the sensor's LEDs is adjusted automatically.
Functional versus
Fractional
Saturation
This pulse oximeter measures functional saturation -- oxygenated hemoglobin
expressed as a percentage of the hemoglobin that can transport oxygen. It
does not detect significant amounts of dysfunctional hemoglobin, such as
carboxyhemoglobin or methemoglobin. In contrast, hemoximeters such as the
IL482 report fractional saturation -- oxygenated hemoglobin expressed as a
percentage of all measured hemoglobin, including measured dysfunctional
hemoglobins. To compare functional saturation measurements to those from
an instrument that measures fractional saturation, fractional measurements
must be converted as follows:
Measured versus
Calculated
Saturation
When saturation is calculated from a blood gas partial pressure of oxygen
(PO
2
), the calculated value may differ from the SpO
2
measurement of a pulse
oximeter. This usually occurs because the calculated saturation was not
appropriately corrected for the effects of variables that shift the relationship
between PO
2
and pH, temperature, the partial pressure of carbon dioxide
(PCO
2
), 2,3-DPG, and fetal hemoglobin. See Figure 25 on page 111.
IXQFWLRQDOVDWXUDWLRQ
IUDFWLRQDOVDWXUDWLRQ
FDUER[\KHPRJORELQ PHWKHPRJORELQ
[
Summary of Contents for OXIMAX N-595
Page 1: ......
Page 8: ...This page intentionally left blank...
Page 13: ...Introduction N 595 5 Figure 4 Trend Softkey Map...
Page 50: ...This page intentionally left blank...
Page 76: ...This page intentionally left blank...
Page 82: ...This page intentionally left blank...
Page 96: ...This page intentionally left blank...
Page 98: ...Data Port Interface Protocol 90 Figure 19 Data Port Setup...
Page 116: ...This page intentionally left blank...
Page 125: ...Figure 27 Main PCB Schematic Diagram Sheet 1 of 13 117...
Page 126: ...Figure 28 Main PCB Schematic Diagram Sheet 2 of 13 119...
Page 127: ...Figure 29 Main PCB Schematic Diagram Sheet 3 of 13 121...
Page 128: ...Figure 30 Main PCB Schematic Diagram Sheet 4 of 13 123...
Page 129: ...Figure 31 Main PCB Schematic Diagram Sheet 5 of 13 125...
Page 130: ...Figure 32 Main PCB Schematic Diagram Sheet 6 of 13 127...
Page 131: ...Figure 33 Main PCB Schematic Diagram Sheet 7 of 13 129...
Page 132: ...Figure 34 Main PCB Schematic Diagram Sheet 8 of 13 131...
Page 133: ...Figure 35 Main PCB Schematic Diagram Sheet 9 of 13 133...
Page 134: ...Figure 36 Main PCB Schematic Diagram Sheet 10 of 13 135...
Page 135: ...Figure 37 Main PCB Schematic Diagram Sheet 11 of 13 137...
Page 136: ...Figure 38 Main PCB Schematic Diagram Sheet 12 of 13 139...
Page 137: ...Figure 39 Main PCB Schematic Diagram Sheet 13 of 13 141...
Page 138: ...Figure 40 Main PCB Assembly Drawing Front View 143...
Page 141: ...Figure 43 Linear Power Supply Assembly Drawing 149 AC FERRITE DC FERRITE...


