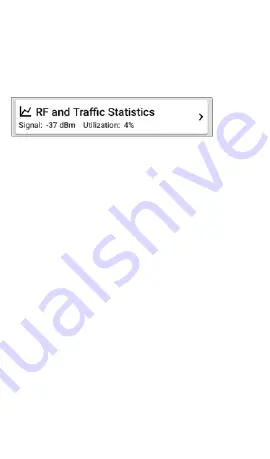
This section describes the common elements of
the RF and Traffic Statistics screen. See the
topic for each type of Details screen for
differences.
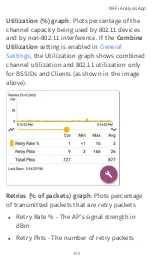
The RF and Traffic Statistics card shows the
Channel number or the Signal strength of the
strongest AP on the channel and the channel's
Utilization percentage.
Tap the card to view graphs of Signal, Noise,
Utilization, and Retries.
To pan and zoom on the graphs, you can
swipe, double tap, and move the slider. See the
topic for an overview of the
graph controls.
Wi-Fi Analysis App
495
Summary of Contents for ETHERSCOPE nXG
Page 20: ...Select Contents to view the list of chapters and choose a section to read Introduction 20...
Page 34: ...Home Screen Home and Android Interface 34...
Page 189: ...received either via Discovery Protocol advert isements or SNMP AutoTest App and Profiles 189...
Page 341: ...Ping TCP Test App 341...
Page 372: ...the screen to search discovered devices Discovery App 372...
Page 381: ...Back to Title and Contents See the Link Live chapter for more information Discovery App 381...
Page 413: ...Discovery App 413...
Page 420: ...Network Servers Network servers include NetBIOS DHCP and DNS servers Discovery App 420...
Page 423: ...Discovery App 423...
Page 432: ...Back to Title and Contents Discovery App 432...
Page 500: ...Touching Locate opens the RF and Traffic Statistics screen Wi Fi Analysis App 500...
Page 602: ...AirMapper App 602...
Page 684: ...Back to Title and Contents Link Live Cloud Service 684...

