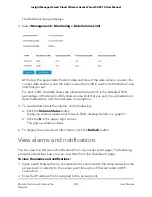
By default, the Clients button is selected.
5. To view traffic information, do the following:
a. Click the Traffic button.
The graph shows the information for WAN (wired) traffic, total WiFi traffic, WiFi
traffic for the 2.4 GHz radio, and WiFi traffic for the 5 GHz radio.
b. To view more information, point to a node on one of the lines on the graph.
6. To view channel utilization, do the following:
a. Click the Channel Utilization button.
The graph shows the channel utilization for the 2.4 GHz radio.
b. To view the channel utilization for the 5 GHz radio, click the 5 GHz button.
c. To view more information, point to a bar.
7. To change the period over which information is filtered and displayed, select the
number of recent hours from the menu to the right of the buttons.
8. To view traffic statistics, select Management > Monitoring > Statistics.
The page displays the network traffic statistics for both the WiFi and wired (Ethernet)
interfaces of the access point since the access point started or rebooted. The page
also displays the number of clients that are associated with each radio.
9. To display the most recent information, click the Refresh button.
User Manual
202
Monitor the Access Point and the
Network
Insight Managed Smart Cloud Wireless Access Point WAC510 User Manual


