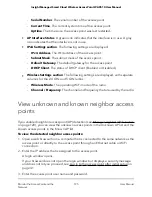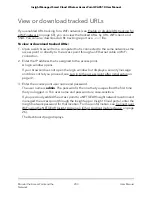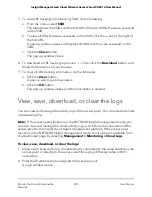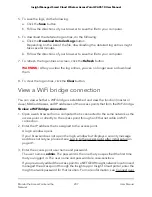
The Dashboard page displays.
4. Select Management > Monitoring > Data Volume Limit.
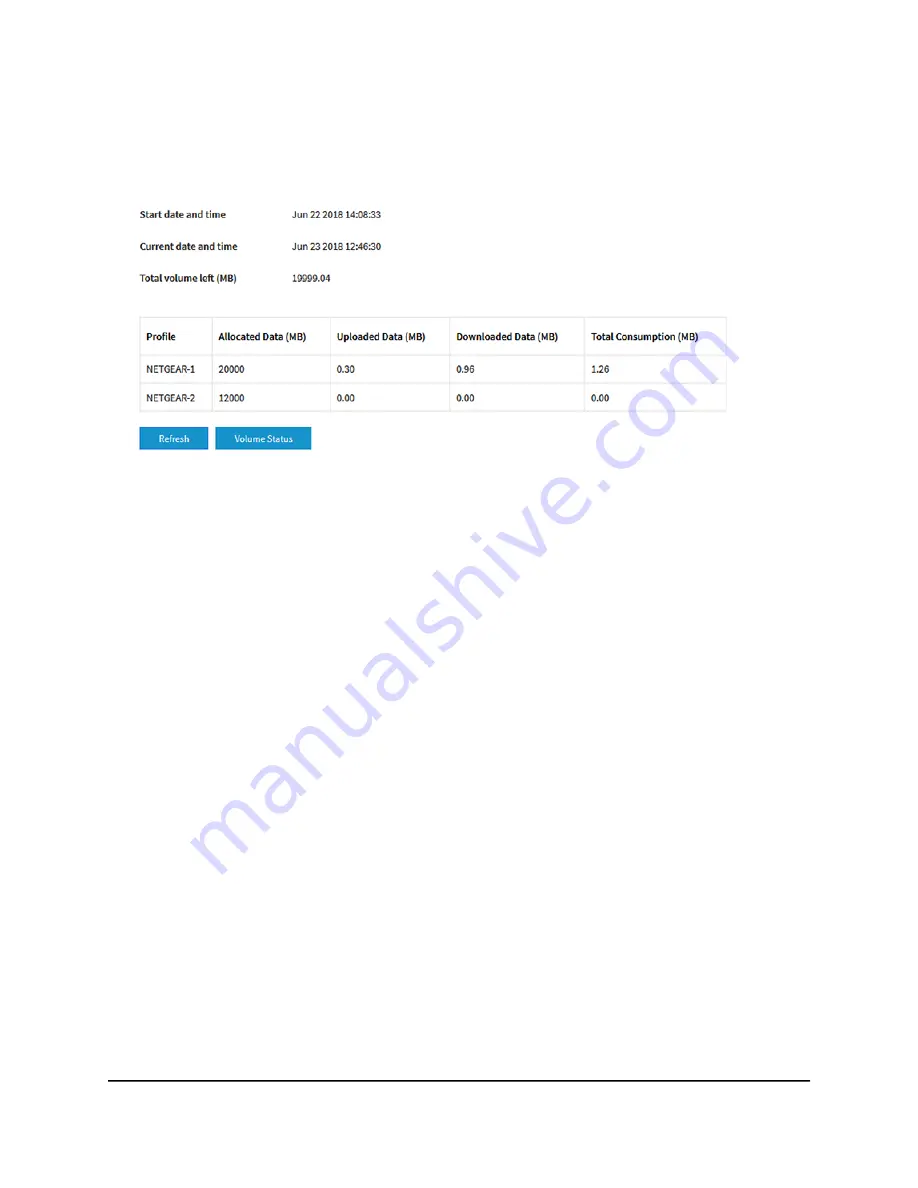
At the top, the page states the start date and time of the data volume counter, the
current date and time, and the total volume that is left in relation to the data volume
limit that you set.
For each SSID, the table shows the allocated data (which is the allocated SSID
percentage of the total monthly data volume limit that you set), the uploaded and
downloaded data, and the total data consumption.
5. To view details about the volume, do the following:
a. Click the Volume Status button.
A pop-up window opens and, for each SSID, displays details in a graphic.
b. Click the X in the upper right corner.
The pop-up window closes.
6. To display the most recent information, click the Refresh button.
View alarms and notifications
You can view the alarms and notifications from any access point page. The following
procedure describes how you can view them from the Dashboard page.
To view the alarms and notifications:
1. Open a web browser from a computer that is connected to the same network as the
access point or directly to the access point through an Ethernet cable or WiFi
connection.
2. Enter the IP address that is assigned to the access point.
User Manual
209
Monitor the Access Point and the
Network
Insight Managed Smart Cloud Wireless Access Point WAC510 User Manual

