View Traffic Analytics and Events for a Traffic Rule
When you add a traffic rule, the router automatically provides traffic analytics for the
rule. If event tracking is enabled for the rule, the router maintains a traffic rule event log.
You can view this information.
To view traffic analytics and events a traffic rule:
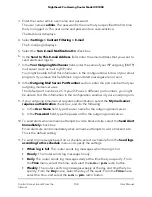
1. Launch a web browser from a computer or mobile device that is connected to the
router network.
2. Enter http://www.routerlogin.net.
A login window opens.
3. Enter the router user name and password.
The user name is admin. The password is the one that you specified the first time
that you logged in. The user name and password are case-sensitive.
The Dashboard displays.
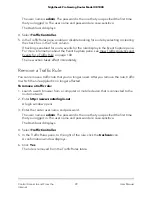
4. Select Traffic Controller.
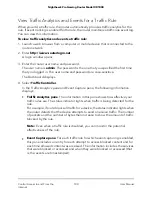
In the Traffic Analytics pane and Event Capture pane, the following information
displays:
•
Traffic Analytics pane. The information in this pane shows how effective your
traffic rules are. The status indicator lights when traffic is being detected for the
rule.
For example, if a rule blocks all traffic for a device, the status indicator lights when
the router detects that the device attempts to send or receive traffic. The number
of packets and the number of bytes then increase to show the amount of traffic
blocked by the rule.
Note: Even when a traffic rule is disabled, you can monitor the potential
effectiveness of the rule.
•
Event Capture pane. For each traffic rule for which event capturing is enabled,
this pane includes an entry for each attempt to access blocked content and for
each time allowed content was accessed. The information includes the services
that were blocked or accessed and when they were blocked or accessed (that
is, the events are timestamped).
User Manual
100
Control Access to and From the
Internet
Nighthawk Pro Gaming Router Model XR1000


