ProSecure Web/Email Security Threat Management (STM) Appliance Reference Manual
6-30
Monitoring System Access and Performance
v1.0, September 2009
–
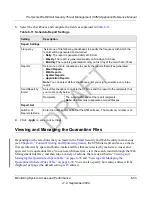
The CPU usage per day in percentage, in a graphic
–
The memory usage per day in percentage, in a graphic
•
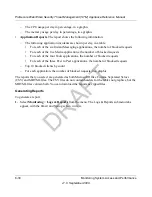
Application Reports
. The report shows the following information:
–
The following application incidents are shown per day, in a table:
•
For each of the six Instant Messaging applications, the number of blocked requests
•
For each of the five Media applications, the number of blocked requests
•
For each of the four Tools applications, the number of blocked requests
•
For each of the three Peer to Peer applications, the number of blocked requests
–
Top 10 blocked clients by count
–
For each application, the number of blocked requests, in a graphic
The reports that you select are generated as both Microsoft Office Comma Separated Values
(CSV) and MHTML files. The CSV files do not contain headers for the tables nor graphics, but the
MHTML files contain both. You can download the reports as zipped files.
Generating Reports
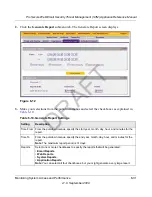
To generate a report:
1.
Select
Monitoring
>
Logs & Reports
from the menu. The Logs & Reports submenu tabs
appear, with the Email and Syslog screen in view.
DRAFT

