Performing an Access Point Range Test
79
NOTE:
If the target of a range test is a hostname that
cannot be DNS-resolved to an IP address for that target,
e.g., netscout.com, the results of the test will be
displayed as follows:
The Ping Stats Field:
Turns
red
, without showing any
data.
The Ping Stats Pull-down menu:
Displays "IP
A DNS Failed".
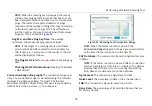
Connection Range Line Graph:
The connection range over
time. The connection range is calculated using this formula:
(Average Ping Response Rate) * (Actual TX Data Rate/
Maximum Possible TX Data Rate). The pane is expanded by
default. Select the up arrow to collapse it.
NOTE:
AirCheck G2 does not roam during a range test. It
disconnects when it goes beyond the AP's signal
coverage area. At the time of connection loss, a
red
vertical line appears on the Connection Range line graph
), but the graph continues scrolling. Once
AirCheck G2 comes back within the range of the AP, it
reconnects with the AP, and a
green
vertical line appears
on the Connection Range line graph.
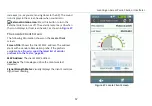
Figure 56. AP Range Test Connection Range Graph
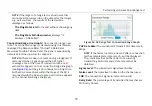
PHY Date Rate:
The connection's Transmit PHY data rate in
Mbps.
NOTE:
If the Tester roams to a new AP after a connection
test has completed, a data rate of
--
will be displayed.
The
--
indicates that AirCheck G2 is not currently
transmitting Wi-Fi data and a data rate cannot be
obtained.
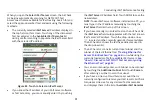
Signal Level:
The connection's signal level in dBm.
Noise Level:
The noise level in dBm on the channel used.
SNR:
The connection's signal-to-noise ratio in dB.
Retry Rate:
The percentage of transmitted frames that are
Wi-Fi retry frames.


