Furthermore, chirped gratings can easily be manufactured by varying the translational
speed during the writing process.
In this section, a description of the procedure used with the
femto
FBG to make a FBG is
presented with great details. In this example, the laser employed is Spectra-Physics Spirit.
Although the writing conditions of this specific example are unique to this FBG, the
procedure remains the same for the fabrication of any other type of FBG.
7.1
Aligning the fiber
1.
The laser is aligned into the femtoFBG as described in Chapter 4.
2.
The sample is loaded (sandwiched between a microscope slide and a cover-slip
using an index-matching gel), properly clamped, and in position as described in
Chapter 4.
3.
The laser output is set at 520 nm, internal repetition rate of 200 kHz, and pulse
divider value of 3174 which corresponds to an effective repetition rate of around
63 Hz (see Appendix I on how to use the Laser software).
4.
Go the femtoFBG software “Move” window.
5.
Turn on LED 1 (which is the bottom illumination one for transmission light
microscopy) and set its intensity so to have a clear not saturated image of the
sample. This is typically achieved with the horizontal bar set at 50% illumination.
6.
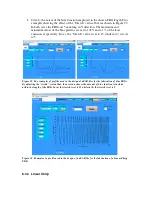
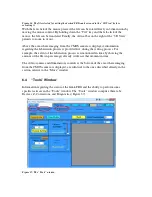
If needed, the quality of the live image can be changed/improved by accessing the
“video Settings) as shown in Figure 40. The camera exposure time and gain can
be varied in this window. Typical values for the exposure time and gain are 41 ms
and 16, respectively.
7.
Use the joystick to position the fiber under the microscope objective so to be
visible in the live CMOS camera streaming window. Often time, this step can be
performed while at the same looking at sample moving so to make sure to move
the stages in in right direction. Obviously, in this case, great care must be
employed to avoid moving the stages too fast.
8.
Once going in the right direction with the stages go back to the computer screen
and keep moving the stages slowly until the fiber appears in the live camera
image.
9.
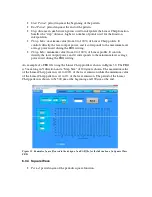
At this point the fiber will appear out of focus as shown in Figure 41.
10.
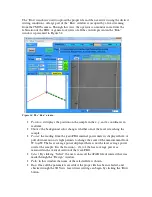
In order to put the fiber (specifically the fiber core) in focus, use the manual
translational stage TS (Figure 6) to move coarsely the OL toward the sample. The
image on the screen will become more in focus until the fiber core borders are
sharp (Figure 42).
11.
The location of the laser focal point within the imaging field of view must now be
located. To achieve this goal, set the “% Power” to 15 (this is the amount of laser
average power reaching the sample using the femtoFBG internal variable power
control) and set the “AOM Intensity %” to 100 (this is the laser intensity output).
Set the “Duration” of the burst to 20 ms and click “Burst”.
12.
At this point, a modification within the fiber is observed in the live imaging
window due to the interaction of the focused laser beam with the sample for 20
milliseconds. This modification will appear as a small dark spot. This spot is
where the laser beam is focused in the imaging plane (remember that conditions


