0110
www.ruggedaq.com
DATALOGGER
NI2400
NI2400
0111
www.ruggedaq.com
DATALOGGER
NI2400
NI2400
You can also click on
Data
in the left menu and get the Data page with the list of all
data source configured in the portal grouped by device:
You can add data source also from this page following a procedure similar to the one
just described.
CREATE THE DASHBOARD AND ADD WIDGETS
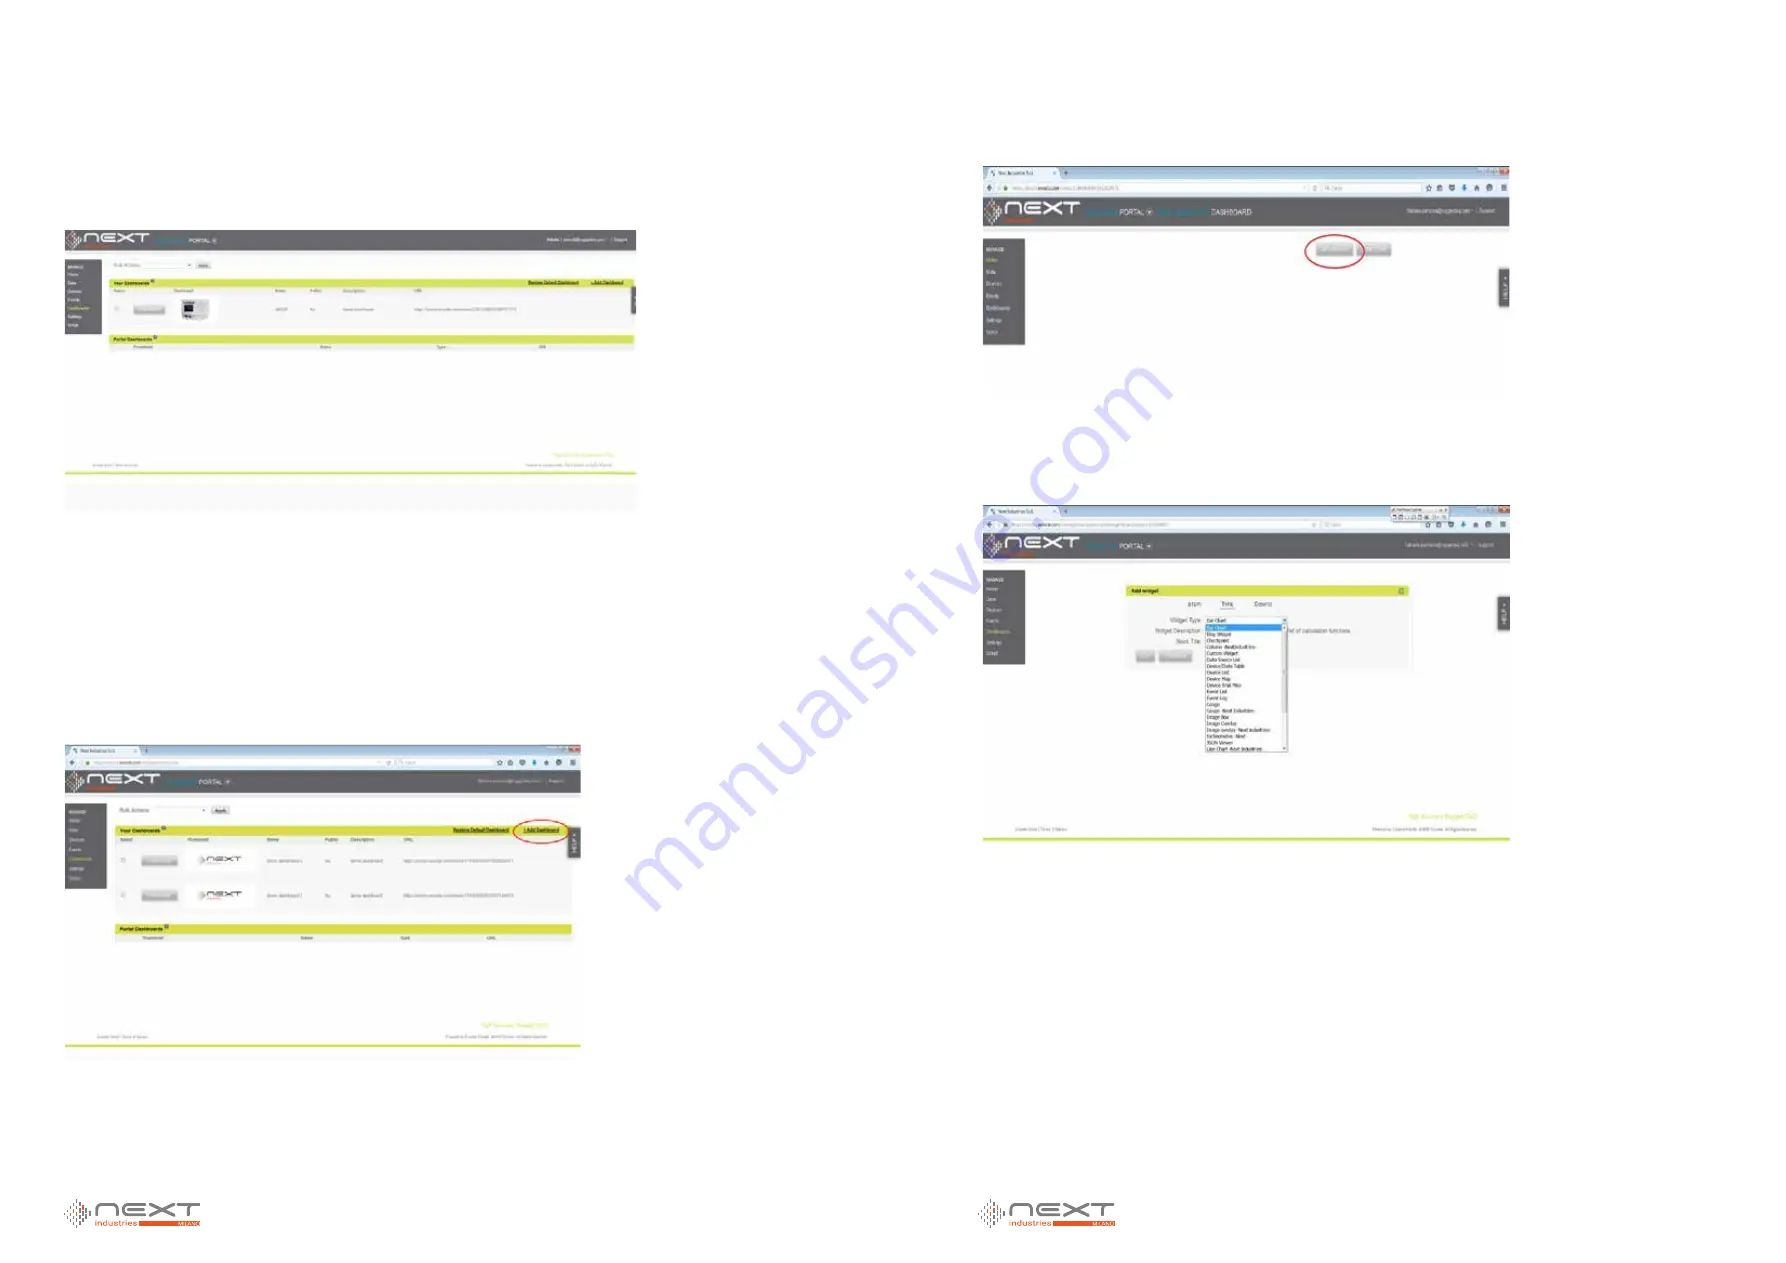
You can create a new dashboard by selecting
Dashboard
in the left menu and clicking
on
Add dashboard
in the top right page. You can add more dashboards in the same
portal and in this page you will have the list of all added dashboards:
By clicking on the dashboard thumbnail you finally have access to the dashboard. Here
you can add widgets needed to monitor the data sources by clicking on ADD WIDGET
button:
By clicking on this button you can select a widget to be added in the list of all available
buttons:
Since OM devices send data to Exosite portal using a custom protocol not all the wid-
gets could be used.
For data source visualization only the following widgets can be used:
Colum -Next Industries-
Gauge -Next Industries-
Image Overlay -Next Industries-
Line chart -Next Industries-
Table -Next Industries-
For generic info visualization (map, device list, event list, event log …) every widget
can be used.
Once widget type is selected you have name it and than, by pressing on CONTINUE,
you can configure the widget with the following page:
Figure 104
Figure 105
Figure 106
Figure 107
5
5


